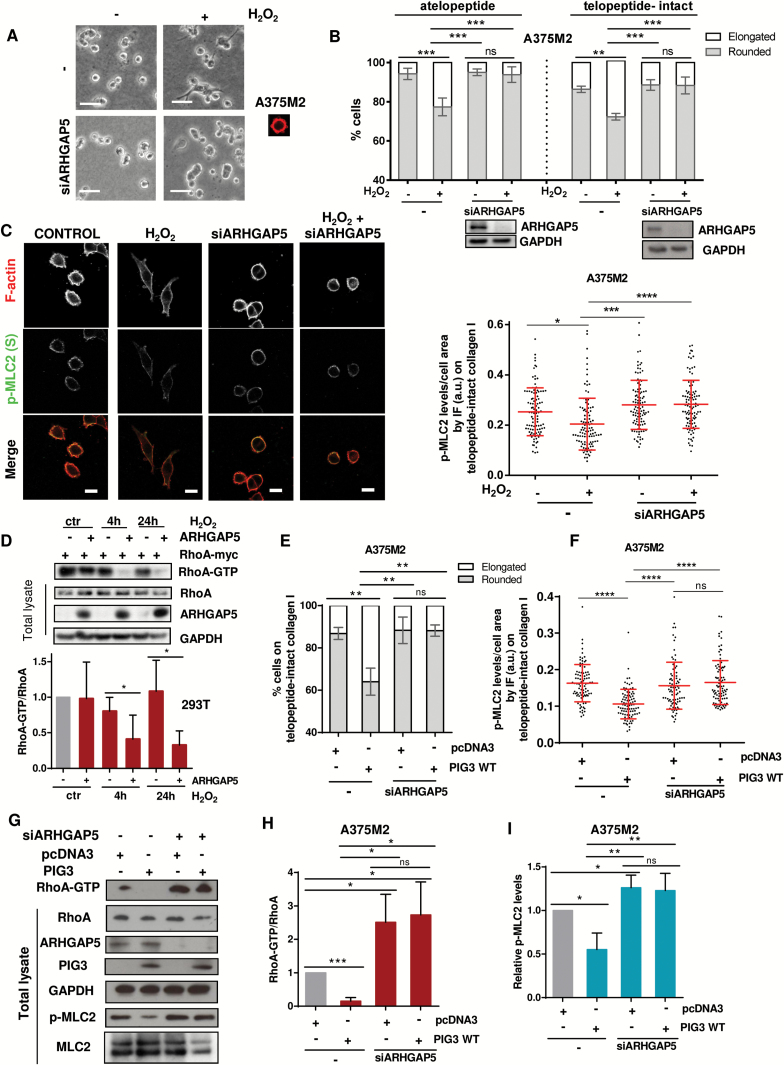
Figure 5.
Regulation of cytoskeletal dynamics via PIG3 and ARHGAP5/P190RhoB. A) Representative bright-field images seeded on atelopeptide bovine collagen I and 72 hours post-transfection, treated with H2O2 (10 μM) for 24 hours. Scale bar = 20 μm. B) Cell morphology of ARHGAP5-depleted A375M2 cells on top of atelopeptide collagen I compared with telopeptide-intact rat tail collagen I after stimulation with 10 μM H2O2 (n = 3, error bars are ±SD, two-sided one-way analysis of variance (ANOVA) with Tukey’s post hoc test was used to generate P values, **P < .01, ***P < .001). Immunoblot for ARHGAP5 is shown below. NS = nonsignificant. C) Representative confocal images (left) of p-MLC2 (green) immunofluorescence (IF) and quantification of p-MLC2 (Ser19) levels (right) of ARHGAP5-ablated A375M2 cells stimulated with H2O2 (10 μM) for 24 hours. F-actin was also stained (red). Each dot represents a single cell; values are relative to the cell area and represented in arbitrary units (a.u.) from three independent experiments (n = 3 experiments; N = 90 cells, error bars are ±SD, two-sided one-way ANOVA with Tukey’s post hoc test was used to generate P values, *P < .05, ***P < .001, ****P < .0001). Scale bar = 20 μm. D) Representative immunoblots (top) and quantification (bottom) showing Myc-RhoA activation and Flag-ARHGAP5 overexpression in HEK293T cells treated with 10 μM H2O2 (n = 3, error bars are ±SD, two-sided Student’s t test was used to generate P values, *P < .05). E) Cell morphology of PIG3-overexpressing A375M2 cells after stimulation with 10 μM H2O2 (n = 3, error bars are ±SD, two-sided one-way ANOVA with Tukey’s post hoc test was used to generate P values, ****P < .0001). F) Quantification of p-MLC2 (Ser19) levels from confocal images of p-MLC2 immunofluorescence (IF) stainings of PIG3-overexpressing A375M2 cells stimulated with H2O2 (10 μM) for 24 hours. Each dot represents a single cell, and values are represented in arbitrary units (a.u.) from three independent experiments. NS = nonsignificant (n = 3 experiments; N = 90 cells, error bars are ±SD, two-sided one-way ANOVA with Tukey’s post hoc test was used to generate P values, ****P < .0001). G) Representative immunoblots showing RhoA activation, ARHGAP5, PIG3, and p-MLC2 levels in A375M2 cells overexpressing PIG3 WT after knocking down ARHGAP5 (n = 4, a representative blot is shown). H) Quantification of Rho-GTP normalized to total Rho levels in PIG3-overexpressing A375M2 cells after depleting ARHGAP5 (n = 4, error bars are ±SD, two-sided Student’s t test was used to generate P values, *P < .05). I) Quantification of MLC2 phosphorylation levels from (G) (n = 4, error bars are ±SD, two-sided Student’s t test was used to generate P values, *P < .05, **P < .01). See also Supplementary Figure 5 (available online).

