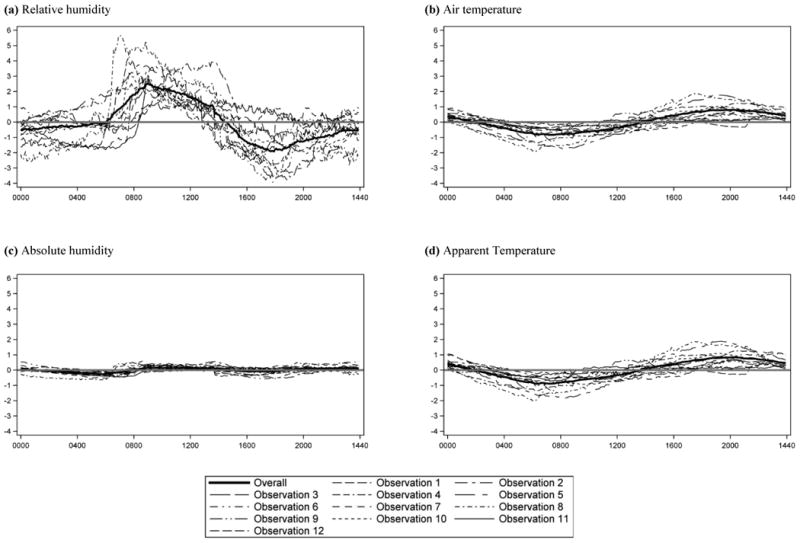
Figure 1.

Deviations from data logger observation means for (a) RH (%), (b) air temperature (°C), (c) absolute humidity (g/m3), and (d) apparent temperature (°C) by time-of-day averages across the sampling period. Time of day is shown in 288 5-min intervals over a 24-hr period. Deviations were calculated by subtracting the household data logger mean from the average RH, air temperature, absolute humidity, and apparent temperature at each time interval.
