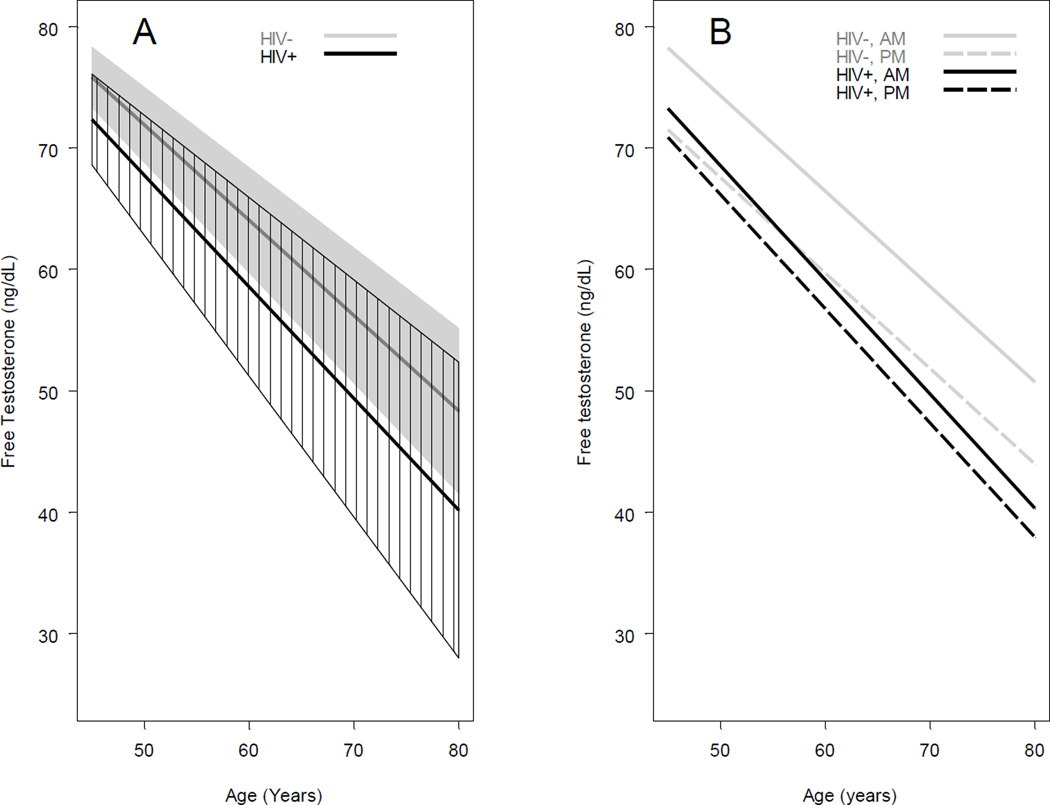
Figure 1. Longitudinal changes in free testosterone levels by HIV-serostatus (A) and by HIV- serostatus and time of blood draw (AM vs PM) (B).
Panel A shows adjusted mean free testosterone (FT) by age from multiple linear mixed model 1 with random intercept and T-distributed errors (estimated degree of freedom = 5) by HIV-serostatus. The gray line in the middle of the gray polygon represents the adjusted mean FT by age for the HIV−, and the gray shading represents its 95% confidence interval. The black line in the middle of the polygon with black shading lines is the adjusted mean FT for the HIV+, and the shaded area represents its 95% confidence interval. Model 1 included factors of HIV-status, age, race, study center, smoking status, BMI, HCV, history of diabetes, cumulative year on HAART for HIV+, time of blood drawn for FT measurement, and the interaction of HIV-status * age. Panel B shows adjusted mean FT by age from multiple linear mixed model 2 by HIV-status and time of blood drawn. Gray solid line represents the adjusted morning (AM) FT for the HIV−, gray dashed line represents the adjusted afternoon (PM) FT for the HIV−, black solid line represents the adjusted AM FT for the HIV+, and black dashed line represents the adjusted PM FT for the HIV+. Model 2 included all factors in model 1 and also the interaction of HIV-status * time of blood drawn.

