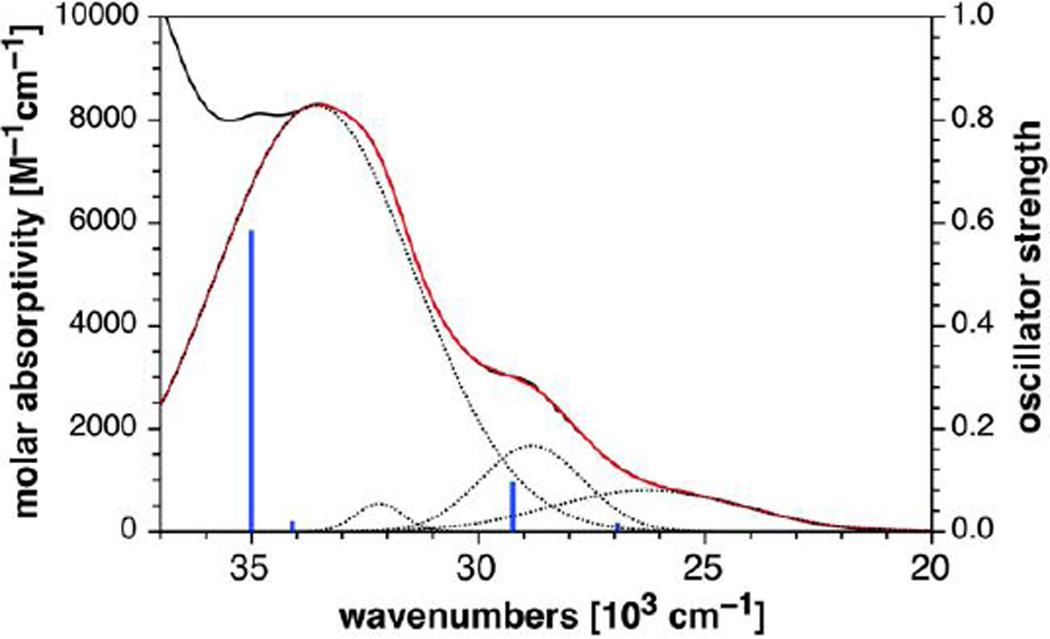
Figure 3.
Gaussian fitting (red trace) for the low-energy portion of the absorption spectrum (black trace) of 3H-pyrazole derivative 10b and comparison to computed vertical excitation energies (blue lines) based on TD-DFT calculations (B3LYP/6–31+G(d)//B3LYP/6–31G(d) level of theory, PCM solvation with methanol). The dashed traces correspond to the individual bands extracted from a fit with four Gaussian functions. The experimental absorption spectrum is plotted on a molar absorptivity scale (left), whereas the intensities of the TD-DFT transitions are represented as oscillator strengths (right).

