Fig. 4.
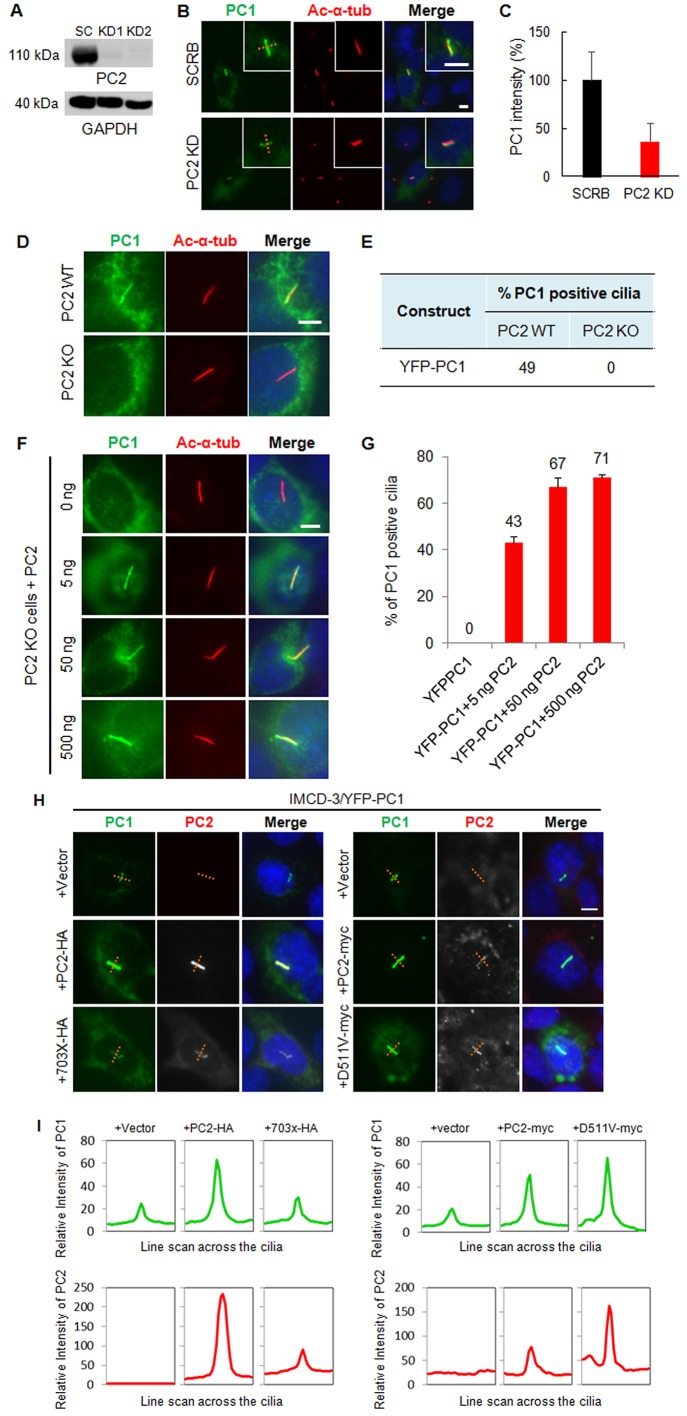
PC2 promotes the ciliary trafficking of PC1 in a dose- and CTT-dependent manner but does not affect its channel activity. (A) Lentiviral shRNA depletion of PC2 in IMCD-3 cells. Western blot analysis showed substantial depletion of PC2 protein in two PC2-knockdown IMCD-3 cell lines (KD1 and KD2) using a rabbit anti-PC2 antibody (96525). GAPDH was used as a loading control. Clone KD1 was chosen for latter experiments. SC, scrambled shRNA control. (B) The ciliary trafficking of PC1 in scrambled control (SCRB) and PC2-knockdown (KD) cells. Acetylated α-tubulin (ac-α-tub, red) marks cilia. PC1 was visualized with an antibody against GFP. A line was drawn across the cilia. Scale bar: 5 µm. (C) The relative intensity of PC1 signal along the line was quantified as described in the Materials and Methods and shown in a bar graph. The intensity of YFP–PC1 in cilia (green) is reduced in PC2-knockdown cells, compared to the scrambled control cells. Results are mean±s.d.; n=3. (D) YFP–PC1 failed to localize to the cilia in PC2-KO cells in contrast to in PC2 wild-type cells. Scale bar: 5 µm. (E) The percentage of cilia with YFP–PC1 in PC2-KO and control cells [n=300 in control cells (from two independent experiments); n=450 in KO cells (from five independent experiments)]. (F,G) The failure of PC1 trafficking to the cilia in PC2-KO cells could be rescued by exogenous PC2 in a dose-dependent manner. PC2-KO cells were co-transfected with YFP–PC1 and wild-type PC2 with different doses of plasmid DNA as indicated. YFP–PC1-positive cilia were quantified for all transfections shown in F. The data from multiple experiments are expressed as mean±s.e.m. (H) The C-terminus of PC2 is essential for promoting PC1 targeting to cilia. HA-tagged PC2-703X or its parental plasmid PC2–HA, Myc-tagged PC2-D511V, or its parental plasmid PC2–Myc, were co-transfected with YFP–PC1 at a molecular ratio 1:1 into IMCD-3 cells. Cells were stained with antibodies against GFP (for PC1, green), HA or Myc (for PC2, red). A line was drawn across the cilia. Scale bar: 5 µm. (I) Line graph indicating that the relative intensity of PC1 in cilia (green) was increased in cells co-transfected with full-length PC2 (wild-type or D511V mutant) but not with the PC2-703X mutant. PC2 (HA or Myc, red) was found on the cilia when PC1 was co-expressed. Representative images from at least three independent experiments are shown.

