Fig. 2.
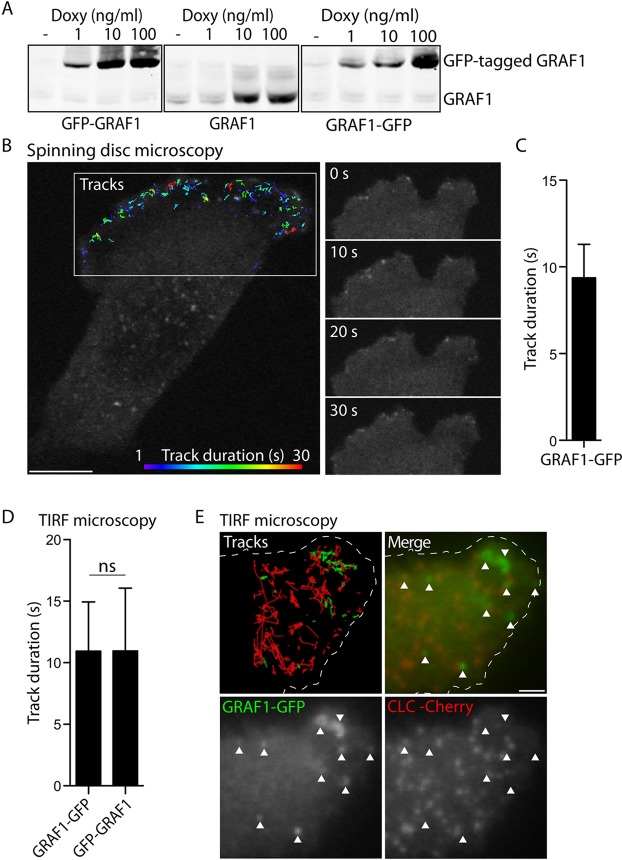
Dynamic assembly of GRAF1 at the leading edge. (A) Immunoblots detecting endogenous and recombinant GRAF1 in Flp-In T-REx HeLa GFP–GRAF1, GRAF1 and GRAF1–GFP cell lysates after induction with the stated doxycycline (Doxy) concentrations for 24 h. A doxycycline concentration of 1 ng/ml was chosen for all subsequent experiments. (B) Fluorescence micrograph detecting GRAF1–GFP, corresponding to the last frame of a live-cell spinning disc confocal microscopy acquisition. At the leading edge, tracks of structure movement and duration over time are illustrated as colour-coded lines. Representative frames from the same acquisition are presented as a time series. Scale bar: 10 μm. (C) Duration time of GRAF1–GFP structure tracks derived from acquisitions exemplified in B. 19 cells from three independent experiments were analysed. The bar graph depicts the distribution of the mean±s.d. values derived from each evaluated cell. (D) Duration time of GRAF1–GFP and GFP–GRAF1 structure tracks derived from live-cell TIRF microscopy acquisitions. Bar graphs depict the distribution of the mean±s.d. values derived from each cell included in the respective analysis. Three independent experiments were analysed (Mann–Whitney U test, n=11–12 cells, α=0.05, ns, not significant). (E) Fluorescent micrograph showing GRAF1–GFP and mCherry-tagged clathrin light chain (CLC) at a protrusion, corresponding to one frame from a live-cell TIRF microscopy acquisition. Tracks visualise the detected structure movement in the respective channel. The edge of the cell is outlined in the upper panels. Arrowheads highlight GRAF1 assemblies. Scale bar: 2 μm.

