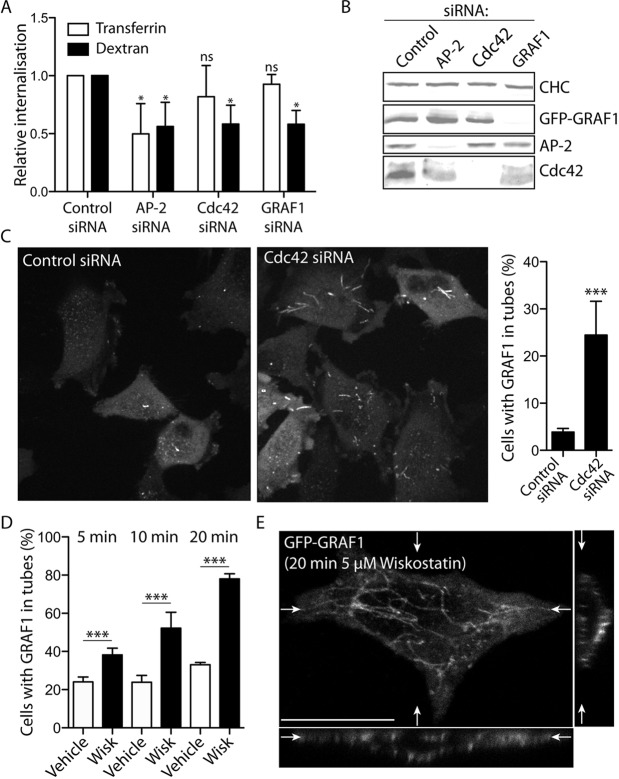
Fig. 3.
Inhibition of Cdc42 function and actin polymerisation affects GRAF1 carrier processing. (A,B) Relative internalisation of aminodextran-S-S-CW800 and transferrin-S-S-CW800 after 30 min uptake in Flp-In T-REx HeLa GFP–GRAF1 cells depleted of AP-2, Cdc42 or GRAF1 by siRNA transfection (A), as confirmed by the immunodetection of the respective protein in comparison to clathrin heavy chain (CHC) in the cell lysates (B). The cargo uptake was normalised to the corresponding control siRNA-transfected sample and the significance in relation to this sample was determined by analyses of at least three independent experiments (mean±s.d.; Mann–Whitney U tests, n=3–4 samples, α=0.05; ns, not significant; *P<0.05). (C) Fluorescent micrographs depicting GRAF1–GFP in control cells and cells depleted of Cdc42. The ratio of cells with GRAF1 in at least one tubular structure (i.e. a structure with a length >2 μm) was quantified on the basis of three independent experiments (mean±s.d.; Chi-square test, n>450 cells, α=0.05; ***P<0.0001). (D) Ratio of cells with GFP–GRAF1 in tubular structures after treatment with DMSO (Vehicle) or wiskostatin (Wisk), for the indicated time intervals. Cells from three independent experiments were included in the analysis (mean±s.d.; Chi-square tests, n>300 cells, α=0.05, ***P<0.0001). (E) Confocal stack of a GFP–GRAF1-expressing cell after 20 min wiskostatin treatment, with presented top and slice views positioned as indicated (white arrows). Scale bar: 10 μm.

