Fig. 3.
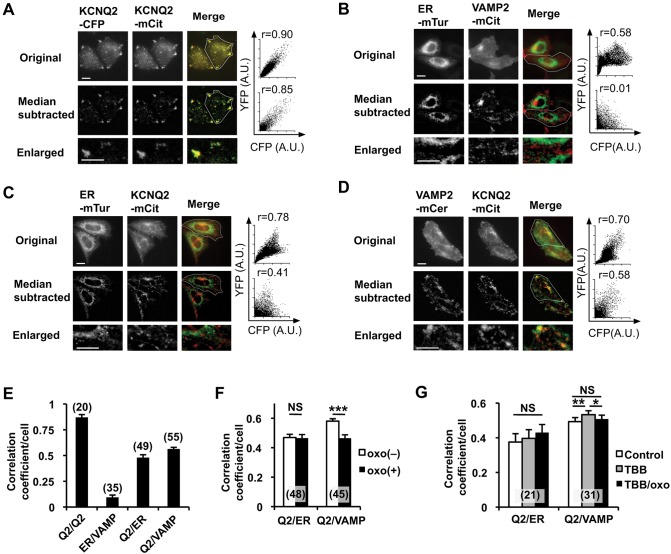
Colocalization analysis of KCNQ2–mCit with ER and post-Golgi markers. (A) Representative original epifluorescent images (top), median-subtracted images (middle) and enlarged images from median-subtracted images (bottom) from cells expressing KCNQ2–CFP (left) or KCNQ2–mCit (middle). Merged (right) images obtained by using a CFP channel (green) and a YFP channel (red) are shown. Scatter plots of fluorescent signals and the Pearson's correlation coefficient from regions of interest (indicated by the white outline) are shown. (B) Negative control for colocalization analyses of ER–mTur and VAMP2–mCit, a post-Golgi vesicular marker, are shown. Pearson's correlation coefficient from original fluorescent images shows moderate correlation owing to background fluorescence. The median-subtracted image shows low background and an improved ability to distinguish the ER- and VAMP2-positive vesicles. (C) Colocalization analyses of ER–mTur and KCNQ2–mCit. (D) Colocalization analyses of VAMP2–mCer and KCNQ2–mCit. (E) Summary histogram of colocalization analyses for the indicated protein pairs shown in panels A–D. The correlation coefficient from each pair was significantly different, at least P<0.01, from that of the others. (F) Changes in the Pearson's correlation coefficient upon application of 3 µM oxo-M between ER–mTur and KCNQ2–mCit and VAMP2–mCer and KCNQ2–mCit. Oxo-M application reduced colocalization between VAMP-2 and KCNQ2. ***P<0.001. (G) Treatment with 10 μM TBB facilitated colocalization and disrupted oxo-M-induced disassembly of KCNQ2–mCit and VAMP2–mCer colocalization. Error bars show s.e.m., n values are given in brackets on the graphs. *P<0.05; **P<0.01; NS, not significant. Scale bars: 10 µm.

