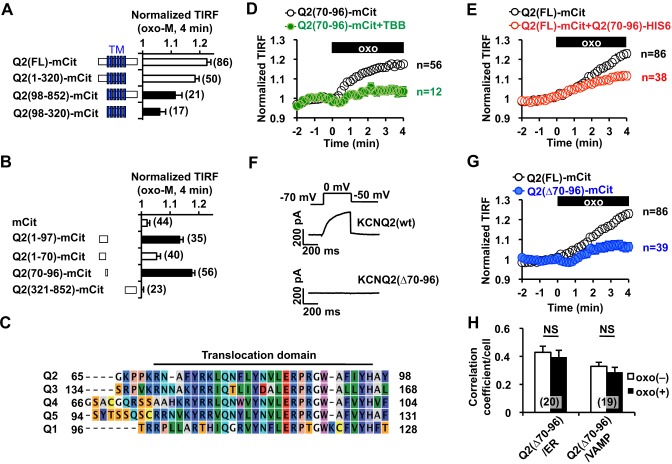
Fig. 4.
Identification of the regulatory domain involved in mAChR-induced KCNQ2 channel surface transport. (A) Summary of deletion analyses, showing that the N-terminal tail is crucial for the mAChR-induced increase in the TIRF signal. Filled bars show responses that were significantly different (P<0.05) from the oxo-M response of full-length KCNQ2, Q2(FL)–mCit. TM, transmembrane domain. (B) Deletion analysis within the N-terminal tail. Q2(70–96)–mCit was the smallest fragment that showed mAChR-induced translocation. Filled bars indicate significant difference (P<0.05) from the negative control (cells expressing mCit alone). (C) Q2(70–96), designated as the translocation domain, is highly conserved among the indicated KCNQ (‘Q’) subtypes. (D) 10 µM TBB treatment inhibited mAChR-induced translocation of Q2(70–96)–mCit that had been stimulated by 3 µM oxo-M (oxo, black box). (E) Overexpression of His6-tagged Q2(70–96) interfered with mAChR-induced surface transport of full-length KCNQ2–mCit [Q2(FL)–mCit] that had been stimulated by 3 µM oxo-M. (F) Representative voltage-clamp current traces for wild-type KCNQ2 [KCNQ2(wt)] and KCNQ2(Δ70–96). (G) KCNQ2(Δ70–96) exhibited a suppressed response to oxo-M. The response of the control construct, Q2(FL)–mCit, from panel E is also shown for comparison. (H) The Pearson's correlation coefficient between KCNQ2(Δ70–96)–mCit [Q2(Δ70–96)] and ER–mTur (ER) as well as VAMP2–mCer. NS, not significant. Error bars show s.e.m., n values are given in brackets on the graphs.

