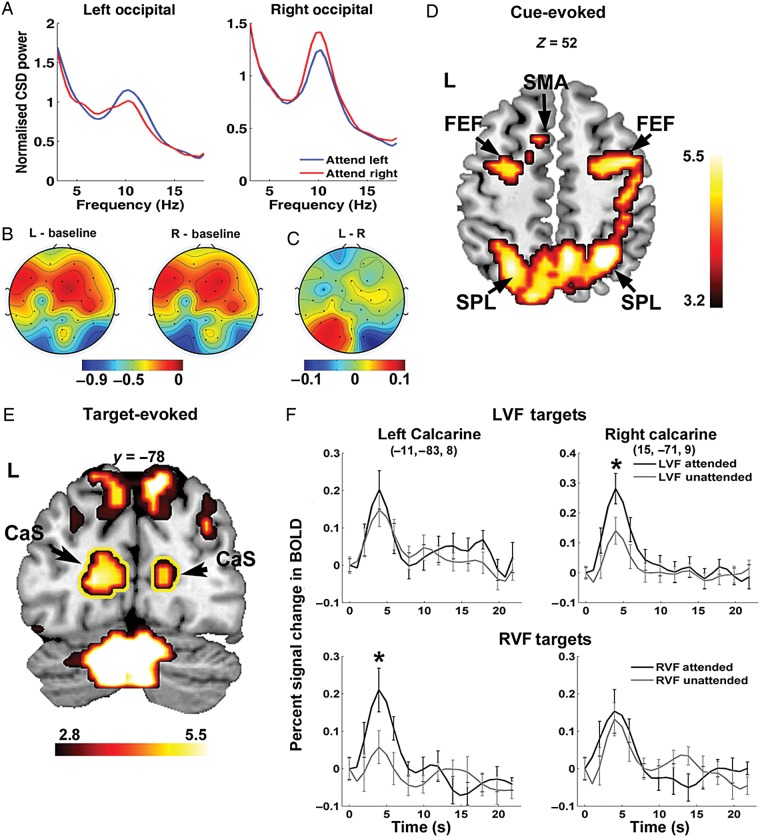
Figure 2.
Attentional modulation of alpha power and BOLD activations. (A) Grand average power spectral density from occipital channels (O1 and O2) showing attentional modulation of alpha (8–12 Hz) during 500–1000 ms after cue onset. (B) Scalp topography showing alpha percentage desynchronization relative to the precue baseline during attend-left (L) and attend-right (R) conditions, respectively. (C) Difference topography contrasting attend-left and attend-right conditions showing asymmetry in alpha desynchronization. Color bars in (B) and (C) reflect percentage changes in alpha power. (D) BOLD activations evoked by the cue showing the engagement of the dorsal attention network during the postcue anticipatory period. (E) A coronal slice (y = −78) showing target-evoked activities in the calcarine sulcus (outlined in yellow), parietal cortices, and the cerebellum. (F) Enhanced BOLD activity (P < 0.05) for attended relative to unattended targets in the calcarine sulcus contralateral to the target location. Activation maps are thresholded at P < 0.05, FDR corrected, and plotted according to the neurological convention with left shown on the left side. FEF: frontal eye field; IPS: intraparietal sulcus; SPL: superior parietal lobule; SMA: supplementary motor area; CaS: calcarine sulcus; LVF: left visual field; RVF: right visual field.

