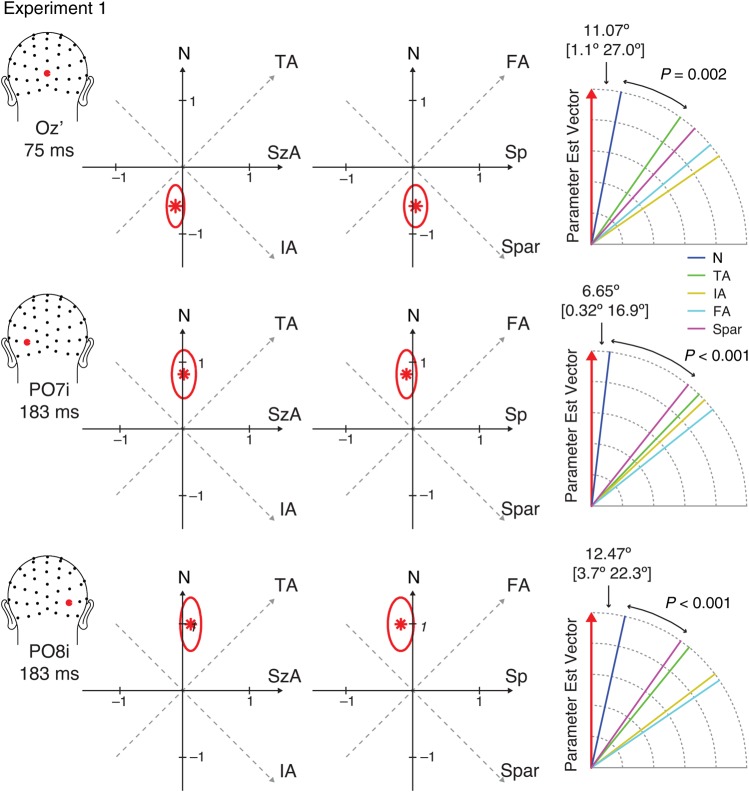
Figure 5.
The parameter estimate vectors, = (βN, βSzA, βSp) (red asterisks) and their 99.9% confidence regions (red ovals) in the parameter space from Experiment 1. The right-most diagram illustrates the angle between and each axis of stimulus properties. The angles between and the closest axis are shown with their 99.9% confidence intervals in closed brackets. The P-values indicate the statistical significance of the test comparing the difference between the angle between and the closest axis and the angle between and the next closest axis.

