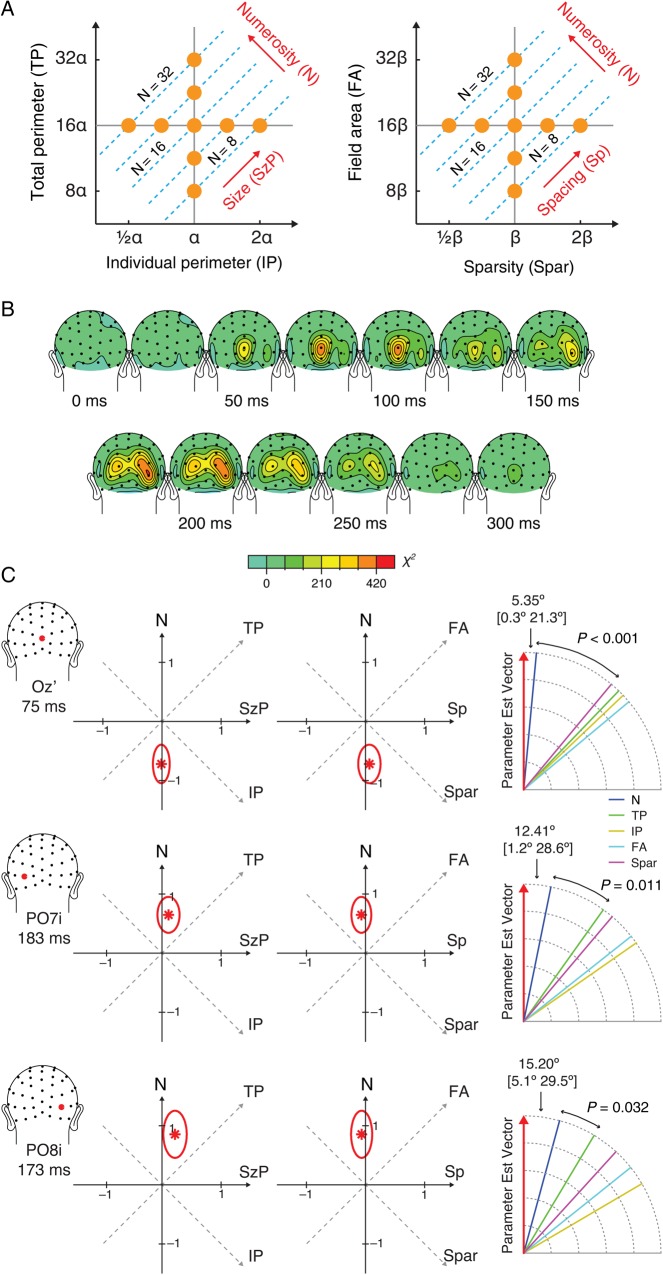
Figure 6.
Stimulus design in Experiment 2 (A), the topographic map of χ2 model fit in 20-ms time windows centered on the specified latencies (B), and the parameter estimates for numerosity, size in perimeter, and spacing (C). See Supplementary Figure 3 for the topographic map of the beta estimates. See figure caption in Figure 5 for the descriptions of the parameter estimate illustrations.

