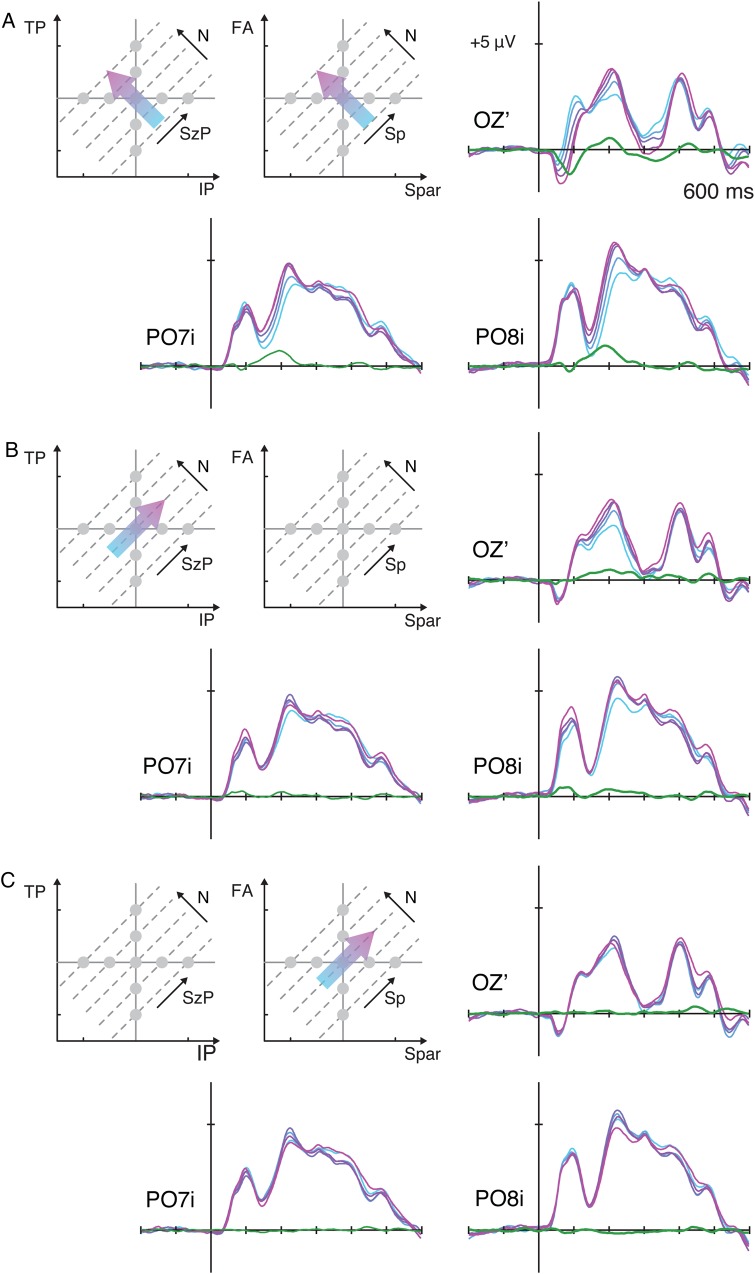
Figure 7.
ERP waveforms from Experiment 2 over the bilateral occipital sites and the medial occipital site plotted as a function of numerosity (A), size in perimeter (B), and spacing (C). See Supplementary Figure S4 for the ERPs sorted along all other dimensions.

