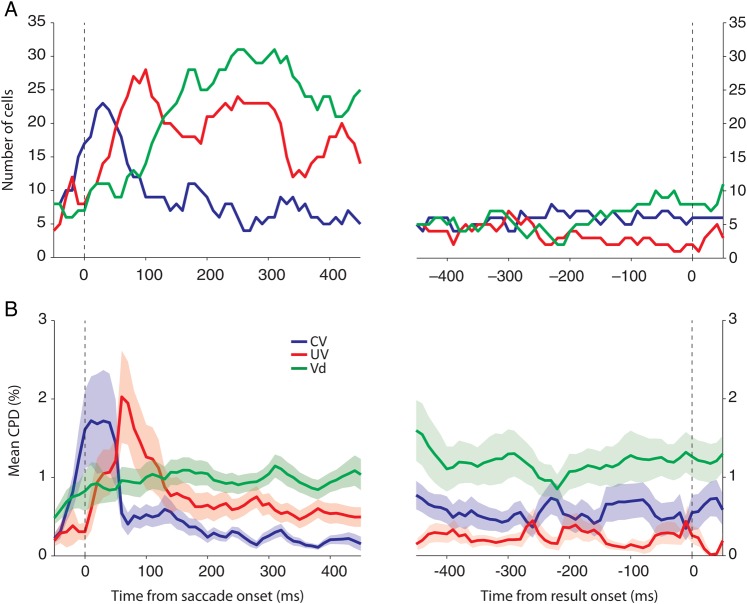
Figure 10.
Temporal dynamics of signals in the SEF representing choice confidence. (A) The number of cells that include each variable in their best models was counted for each time bin (overlapping window; 50 ms width with 10 ms step). (B) Mean CPD for each variable at each time bin. Shaded areas represent SEM.

