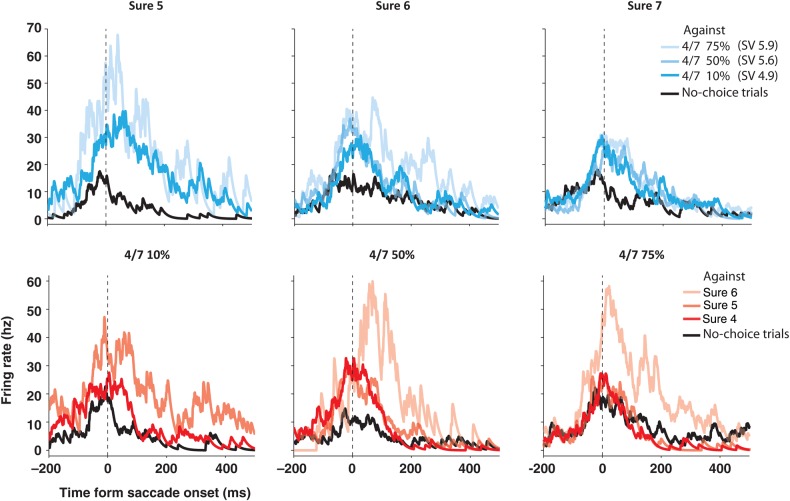
Figure 6.
SEF neuron with choice contingent activity during the delay period. Spike density histograms show activity separately for different chosen options, aligned on the saccade onset. The upper row shows the activity when sure options of increasing value were chosen (due to increasing payoff: 5–7 units of reward). The lower row shows activity when gamble options of an increasing value were chosen (due to increasing winning probability: 10–75%). Within each spike density histogram, trials were sorted by the unchosen alternative option (upper row: sure option chosen over 4 vs. 7 gamble with a winning probability of 10%: pale blue, 50%: light blue, and 75%: dark blue; lower row: 4 vs. 7 gamble chosen over sure option with a payoff of 4: pale red, 5: light red, and 6: dark red; all in units of reward). During no-choice trials, the activity (black line) was very similar across reward options, and nearly always lower than when the same option was chosen in a choice trial (blue or red lines). During choice trials, the activity was not only larger, but also systematically influenced both by the chosen and unchosen option. In general, the activity was stronger as the unchosen option was more valuable than the chosen option. This can be seen, for example, by comparing the activity when sure options of increasing value (from 5 to 7) were chosen against a 4 vs. 7 gamble option with a 75% chance of winning (pale blue lines in the upper row). When the choice was made against the same alternative, the activity was strongest for the least valuable chosen option and weakest for the most valuable chosen option. Thus, this neuron seems to be influenced by the comparative value of the chosen option.

