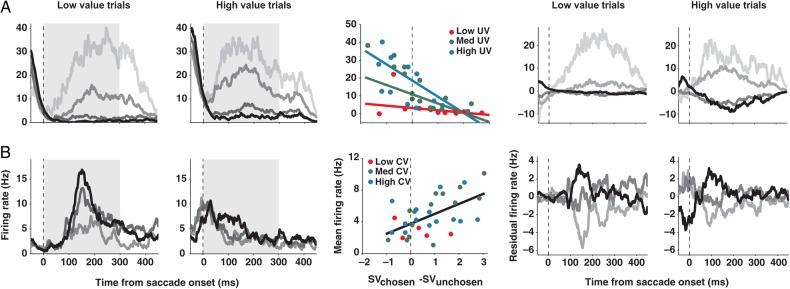
Figure 7.
SEF neurons representing decision confidence during the delay period. Spike density histograms show activity separately for trials with a low-value gamble option (1 unit of reward for losing and 4 units for winning) and for trials with a high-value gamble option (4 vs. 7 units of reward). The activity is aligned on the saccade onset. Within each spike density histogram, trials were sorted by the range of value difference (Vd) between the chosen and unchosen option (Vd = 2.5 to 1.5 [black], 1.5 to 0.5 [dark gray], 0.5 to −0.5 [medium dark gray], −0.5 to −1.5 [light gray]; all in units of reward, 1 unit = 30 µL of water). The histograms to the left of the regression plot show the actual firing rate, whereas the histograms to the right show the residual firing rate that was due to value difference after accounting for the influence of CV or UV and saccade direction. The activity of SEF neurons could be negatively (A) or positively (B) correlated with Vd. The best regression model for each example neuron is plotted in the middle of the histograms. Neuronal activities (dots) are plotted against the value difference between the chosen and unchosen option. Three different ranges of CV or UV are indicated by the dot color (low [red]: 1–3; medium [green]: 3–5; high CV or UV [blue]: 5–7; all in units of reward). Lines describe the best regression model when the CV or the UV was 7 (blue), 4 (green), and 1 (red) units of reward. When there is no modulation by CV or UV, different colored lines collapse into a single black line. Only the conditions that include more than 5 trials were plotted to make the figures less noisy.

