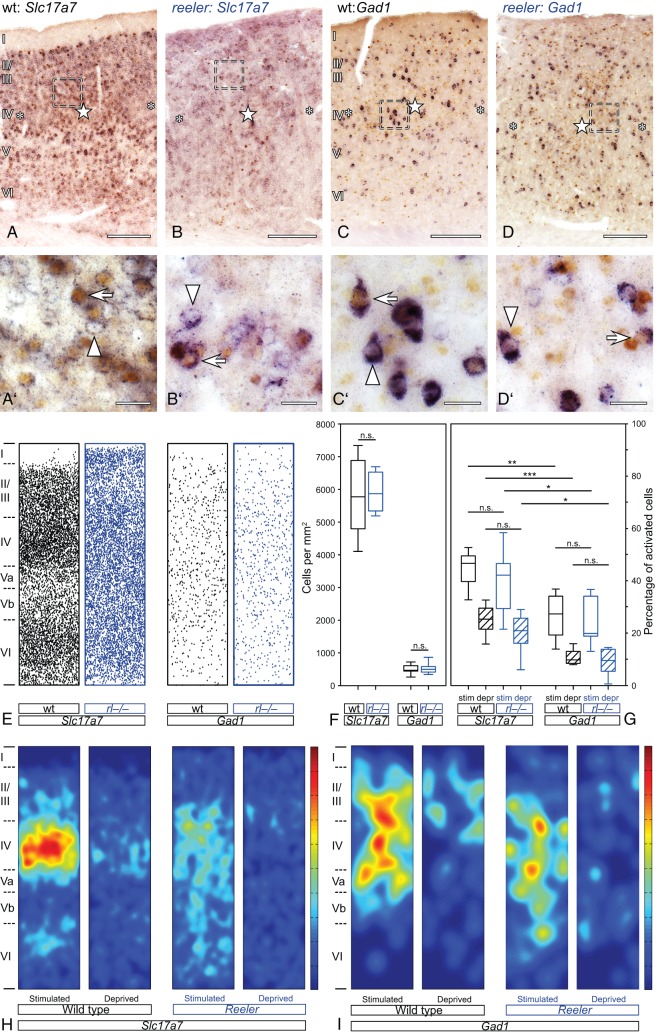
Figure 6.
Activation of excitatory and inhibitory wild-type and reeler neurons after tactile exploration of a novel, enriched environment. (A–D) Stimulated and unstimulated barrel-related columns in the primary somatosensory “barrel” cortex. Excitatory (Slc17a7; A,B) or inhibitory (Gad1; C,D) neurons were labeled by chromogen RNA in situ hybridization (purple staining). Activated neurons were identified via immunostaining for the immediate early gene c-fos (DAB; brown staining of the nuclei). Stimulated columns are marked by a star in the wt barrel (A,C) or in reeler barrel equivalents, respectively. (B,D) Unstimulated columns are marked by asterisks. (A′–D′) The micrographs show a higher magnification of the area delineated by the dashed frames in A–D. Exclusively marker-labeled neurons are indicated by arrowheads, arrows point at marker-labeled neurons that show a c-fos-positive nucleus. (E) Distribution of excitatory and inhibitory neurons in reconstructed normalized columns. Each indicated column represents a superposition of functional columns from 6 individual sections. (F, G) Boxplots show the density of excitatory and inhibitory neurons (F) and the strength of the activation (G). Note that stimulated columns always show a higher amount of activated neurons and that the strength of activation is not significantly different between wild type and reeler. Bottom and top of the boxes represent the 25th and 75th percentiles, respectively; the bar in the box indicates the median. The ends of the whiskers represent the minimum or maximum, respectively. (H, I) Heat map represents the location of the activated nuclei within the functional column. Again, each displayed column represents a superposition of functional columns from 6 individual sections. Dark red indicates the highest density of activated neurons, and dark blue indicates the lowest. This value individually refers to the population of either excitatory or inhibitory neurons. Scale bars: A–D 200 µm; A′–D′ 20 µm.

