Figure 11.
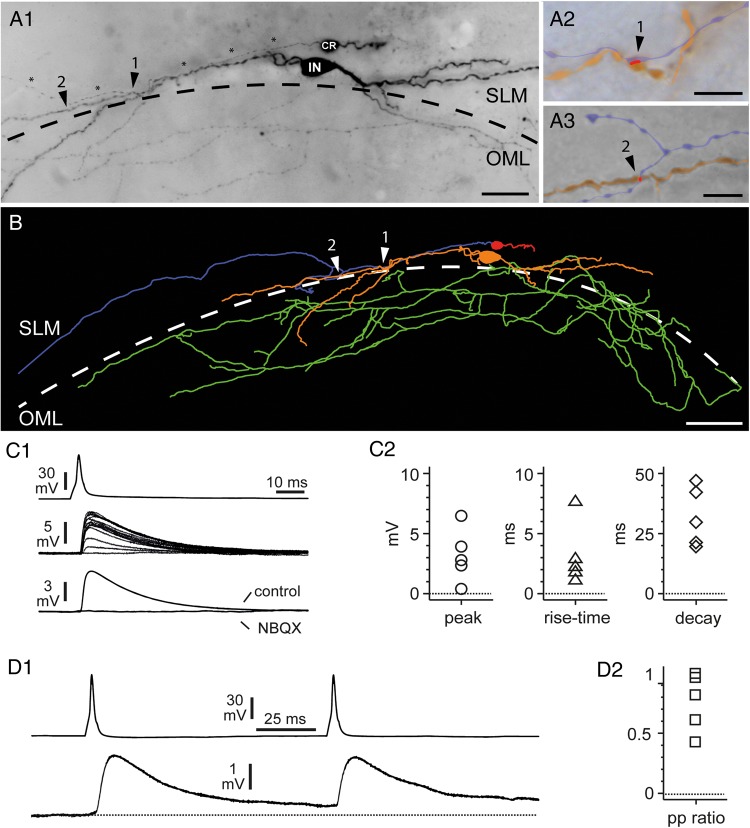
Morphology and basic functional properties of a CR cell to a GABAergic interneuron synaptic connection. (A1) Light micrograph of a biocytin-filled, synaptically coupled pair between a presynaptic CR cell and a postsynaptic GABAergic interneuron (IN). Both cells were located in the SLM close to the HF (dashed line). Note the CR cell axon (marked by asterisks) running parallel to an interneuron dendrite establishing 2 putative light microscopically identified synaptic contacts, marked by arrowheads, and numbers. Slice obtained from a P17 mouse. (A2,A3) High-power light microscope images of the 2 putative light microscopically identified synaptic contacts of the presynaptic CR cell axon (blue) with the postsynaptic interneuron dendrite (orange) as indicated by arrowheads. The putative contact area is highlighted in red. (B) NEUROLUCIDA reconstruction of the synaptically coupled pair shown in A1. The somatodendritic configuration is given in red (CR cell) or orange (IN) and the axonal domain in blue or green, respectively. The putative synaptic contacts are marked by white arrowheads and numbers. Scale bars in A1 25 µm, (A2–A3) 5 µm and B 50 µm. (C1) Paired recording between a presynaptic CR cell and a postsynaptic interneuron with the somata on the hippocampal fissure. Current injection triggers a spike in the CR cell (top trace), which generates a uEPSP in the interneuron (middle traces). Notice the variability of the response and the presence of a failure. Notice also that individual response may be very large and reach amplitudes of ∼10 mV. The bottom traces show the unitary response recorded in regular ACSF (control) and after the addition of NBQX (20 μM). (C2) Summary plots showing the basic properties (peak amplitude, 20–80% rise time and 100–37% decay time) of the uEPSPs recorded in 5 connected pairs. (D1) Paired-pulse modulation of CR Cell uEPSPs. The upper trace shows 2 action potentials triggered at 10 Hz in the presynaptic CR cell, whereas the lower trace shows the postsynaptic response. Notice the presence of a mild depression. (D2) Summary graph of paired-pulse modulation (peak of the second uEPSP over the peak of the first EPSP: pp ratio) for the 5 connections tested. Notice the presence of short-term depression in most uEPSPs.

