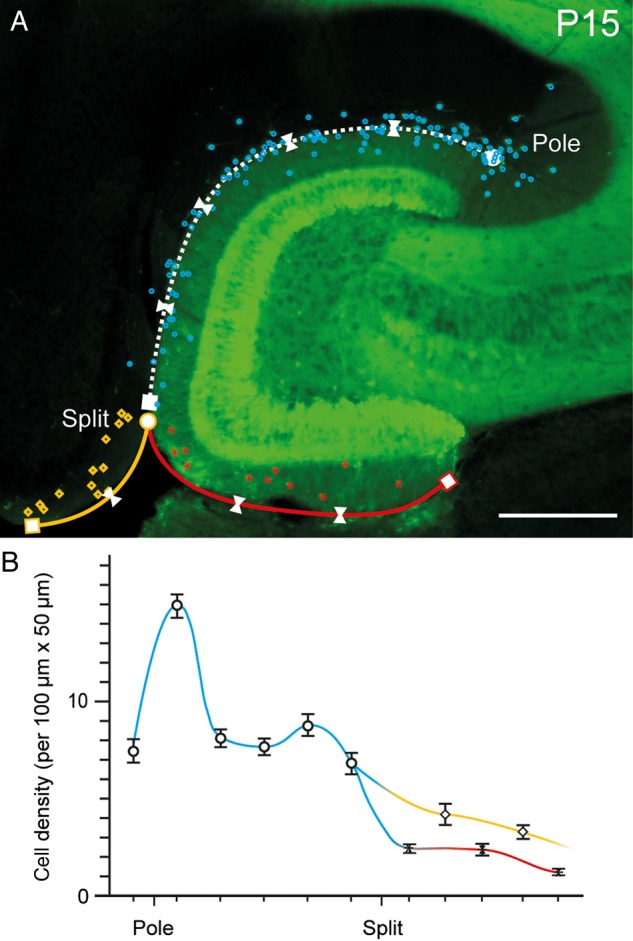
Figure 2.

Density and distribution pattern of CR cells in the hippocampus. (A) Distribution of EGFP-labeled CR cells in a horizontal slice through the hippocampal formation at P15. CR cells are highlighted by different colors indicating their areas of location (blue dots: HF region, red asterisks: OMLip of the dentate gyrus, yellow rectangles: L1 of the subicular complex/entorhinal cortex). Split indicates the pial fusion point. White triangles mark the different counting areas along the HF. Pole indicates the termination of the hippocampal fissure in the CA3 subregion. Scale bar 250 µm. (B) Summary line histogram of the density of CR cells along the various regions of the hippocampal formation color coded as in A. Note the steep increase and plateau in the number of CR cells along the HF (blue line) and the steady decline in L1 (yellow line) and OMLip (red line).
