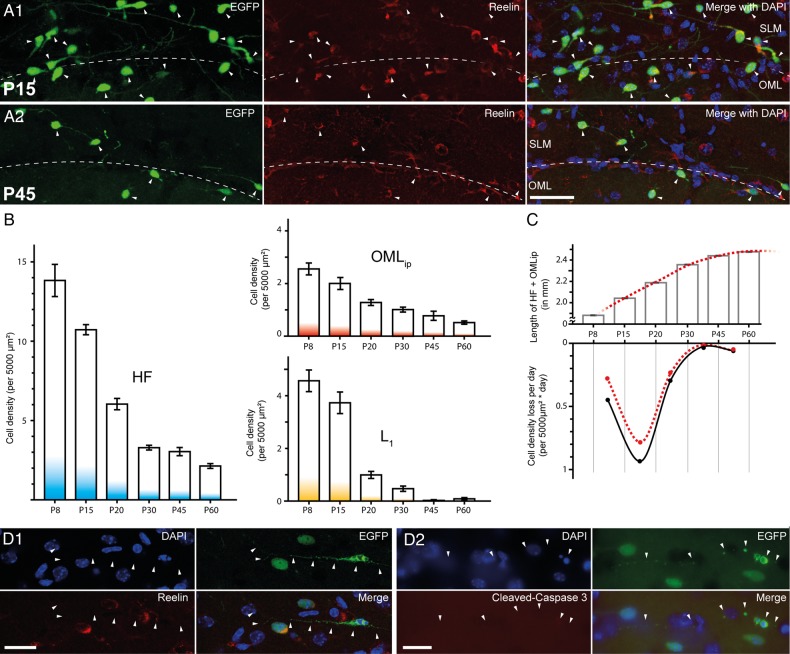
Figure 3.
Developmental-dependent decline of CR cells in the hippocampal formation. (A1,A2) Multichannel fluorescent images showing the distribution of EGFP-labeled CR cells at the HF (dashed line; left panel), which are all reelin-positive (middle panel) and the merge image (right panel, with added DAPI counterstain) at P15 (A1) and at P45 (A2). Scale bar 50 µm. (B) Bar histograms showing the time course of CR cell density decline along the HF region (left panel), at the OMLip of the dentate gyrus (upper right panel), and L1 (lower right panel). Note the different time course of CR cell loss in the 3 subregions. (C) Upper panel: summary graph of the developmental growth of the HF-OMLip border length between P8 and P60. Lower panel: average density loss of CR cells per day during the same developmental time points shown in B before (black dots and curve) and after correction for hippocampal growth (red dots and dashed curve). (D1) Multichannel fluorescent images demonstrating early state apoptosis of an EGFP-labeled CR cell with the typical signs of degeneration (pyknotic nucleus and condensed cytoplasm). Notice the lack of reelin immunoreactivity. (D2) Another example of an apoptotic EGFP-labeled CR cells. Note the lack of cleaved caspase 3 immunoreactivity in the CR cell. Scale bar D1–D2 25 µm.

