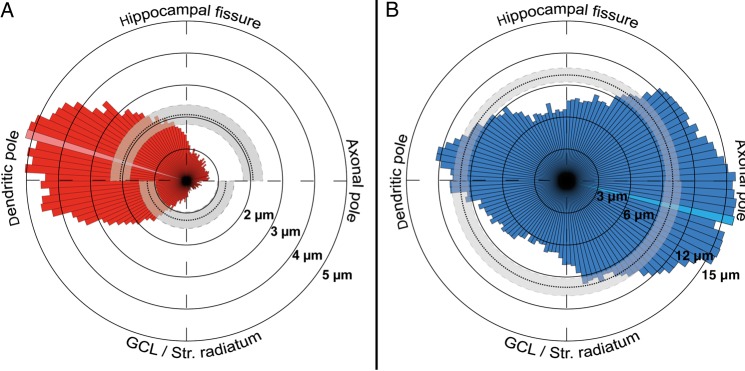
Figure 6.
Quantitative analysis of the dendritic and axonal arborization of hippocampal CR cells. (A,B) Polar plots of the dendritic (red, left panel) and axonal domains (blue, right panel) of all CR cells investigated given as a radial bar histogram with 3° intervals. The dashed lines indicate mean values; gray areas mark the 95% confidence intervals. Maximum values are indicated by the light red and blue region within the histogram, respectively.

