Fig. 2.
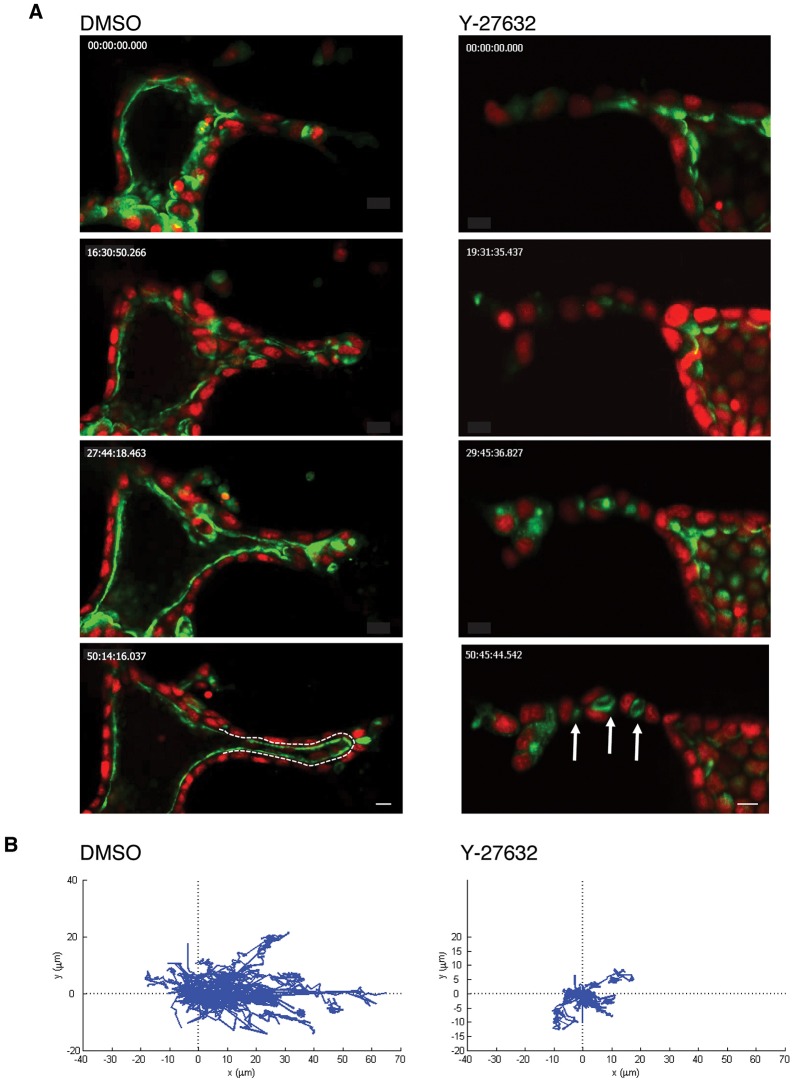
ROCK regulates oriented cell motility in a 3D matrix. (A) Selected stills of time-lapse sequences of a control (left panels; Movie 1) and Y-27632-treated 3D structures expressing an apical membrane marker, GFP fused to podocalyxin (GFP–PODXL), and a nuclear marker, monomeric RFP fused to histone 2B (mRFP–H2B, right panels; Movie 2). Time is indicated in min:seconds. Scale bars: 10 μm. Arrows indicate multiple lumens and the dashed line outlines the lumen. (B) Migration tracks of cells are displayed as displacement plots. For each group, the trajectories of 15 to 30 cells at 30 min intervals over 45 h are presented. The origin of each track was superimposed at position (0, 0).

