Fig. 5.
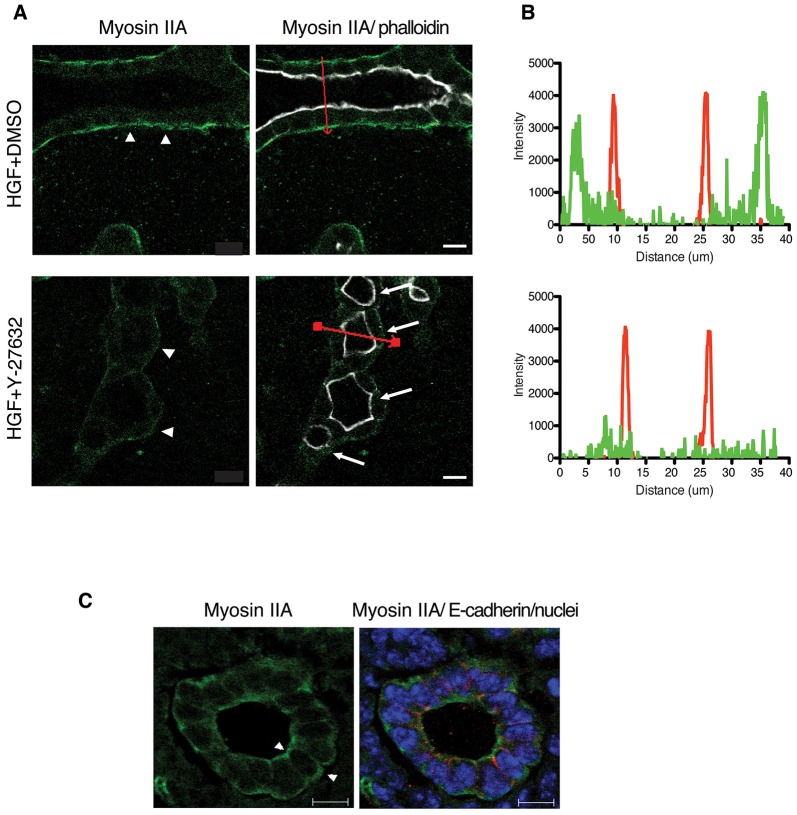
ROCK inhibition attenuates the localization of myosin IIA at the basal surface of tubule. (A) Myosin IIA [green, shown separately in top panels; merged with phalloidin (white) in bottom panels] at the periphery of tubular structure is substaintally reduced upon Y-27632 treatment. Arrows indicate multiple lumens. Scale bars: 10 μm. (B) Myosin IIA (green) and phalloidin (red) fluorescence intensity ratios were quantified along the cross-section indicated in red in A (right panels). All measurements were carried out on confocal images and the line-scan analysis for pixel intensity was performed using a Zeiss LSM510 microscope. (C) Representative images of myosin IIA (left) and merged with E-cadherin (red), and nuclei (blue) (right) in E17.5 mouse kidney. Scale bars: 10 μm.

