Fig. 2.
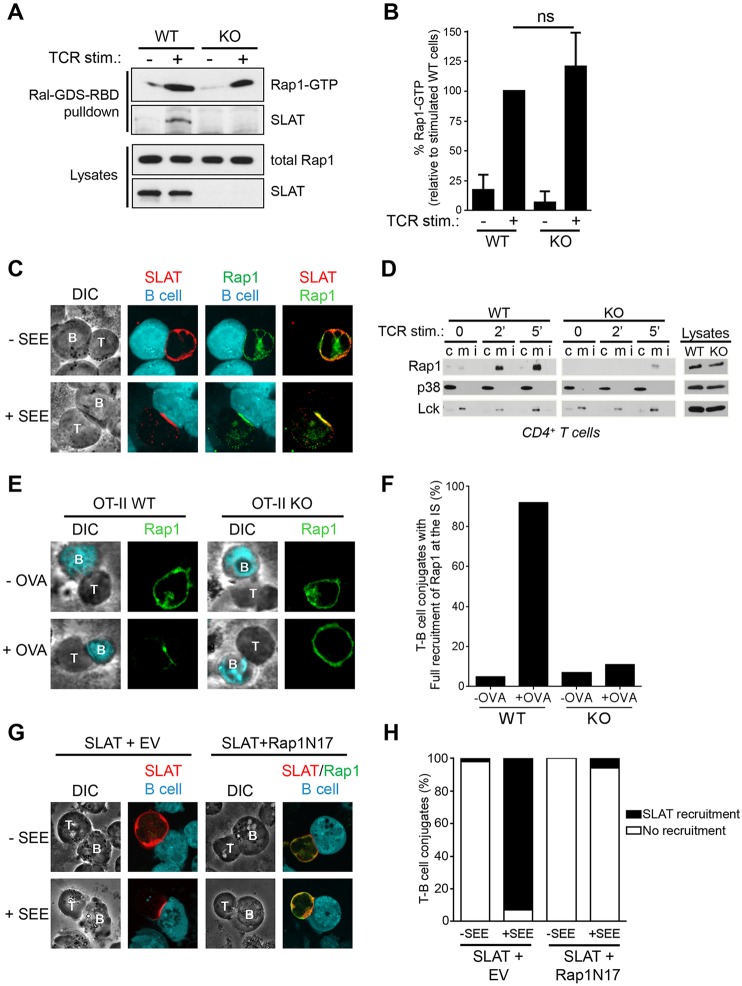
Interdependent co-recruitment of SLAT and Rap1 to the plasma membrane and immunological synapse upon TCR stimulation. (A) WT or Def6−/− (KO) CD4+ T cells were either left untreated or stimulated with 10 µg/ml anti-CD3 mAb for 3 min. Active (GTP-loaded) Rap1 was precipitated using a GST–RalGDS-RBD fusion protein. Precipitates (Ral-GDS-RBD pulldown) and whole-cell lysates were analyzed by immunoblotting with the indicated antibodies. One out of four representative experiments is shown. (B) Bar graphs representing mean±s.d. densitometry data pooled from four independent pull-down experiments as shown in A. (C) Jurkat JA16 cells were co-transfected with Myc-tagged SLAT and Xpress-tagged Rap1. After 24 h, the cells were stimulated or not with SEE-pulsed CMAC-labeled Raji B cells and conjugates were bound to poly-L-lysine-coated coverslips, fixed, and stained with anti-Myc and anti-Xpress plus secondary Alexa-Fluor-555-coupled anti-rabbit-Ig or Alexa-Fluor-488-coupled anti-mouse-Ig antibodies, respectively. Individual and overlay of the green (SLAT), red (Rap1) and blue (B, B cell) images along with differential interference contrast (DIC) images are shown. T, T cell. Data shown are representative of three independent experiments. (D) Purified splenic CD4+ T cells from WT or Def6−/− (KO) mice were stimulated for the indicated times with an anti-CD3 mAb. Membrane (m), cytosolic (c) and detergent insoluble (i) fractions were prepared, resolved by SDS-PAGE, and immunoblotted with the indicated antibodies (left panels). Expression of p38 MAPK (detected using an antibody recognizing all isoforms) and Lck in the cytosolic and membrane fractions, respectively, confirmed proper separation of the respective fractions. Analysis of protein expression in whole-cell lysates (right panels) revealed no difference of expression of Rap1, Lck or p38 MAPK in WT versus KO cells. (E) WT or Def6−/− OT-II CD4+ T cells were pulsed with OVA323–339 peptide (+OVA) or not pulsed (−OVA) dendritic cells for 20 min. T-cell–dendritic cell conjugates were then stained for Rap1 expression and localization. Corresponding DIC images are shown. (F) Quantitative analysis of the results shown in E. Rap1 and/or SLAT localization in the immunological synapse was analyzed in 100 T-dendritic cell conjugates. The graph represents the mean percentage of imaged cells scored in each group (recruitment versus no recruitment to the immunological synapse) and is representative of three experiments. (G) Jurkat JA16 cells were co-transfected with Xpress-tagged SLAT along with empty vector (EV) or Myc-tagged dominant-negative Rap1 (Rap1N17). After 24 h, the cells were stimulated or not with SEE-pulsed CMAC-labeled Raji B cells and conjugates were bound to poly-L-lysine-coated coverslips, fixed, and stained with anti-Xpress and anti-Myc plus secondary Alexa-Fluor-555-coupled anti-mouse-Ig or Alexa-Fluor-488-coupled anti-rabbit-Ig antibodies, respectively. Individual and overlay of the red (SLAT), green (Rap1N17) and blue (B cell) images along with DIC images are shown. (H) Quantitative analysis of the results shown in G, representing approximately 100 T-cell–B-cell conjugates analyzed.

