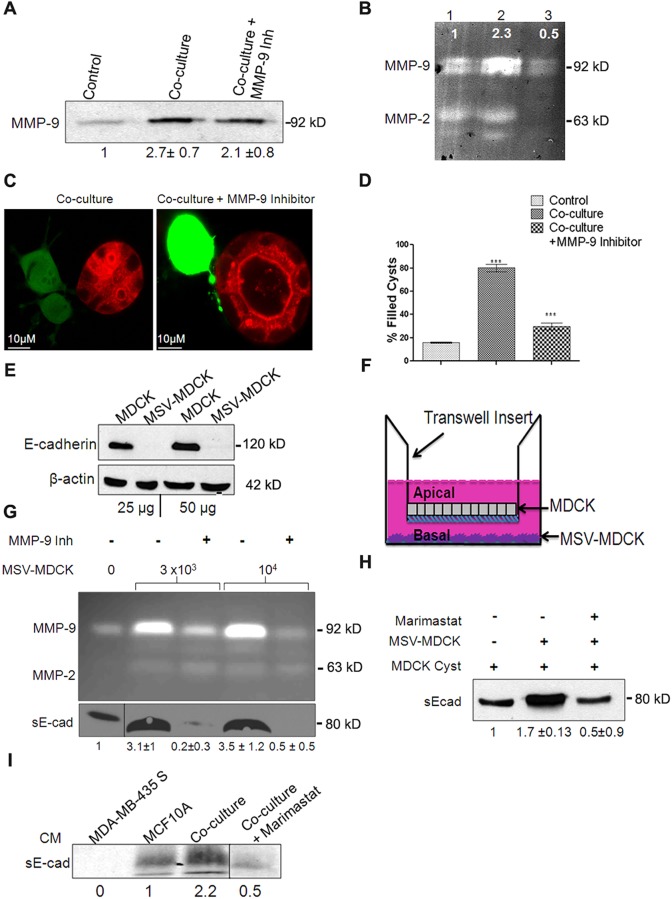
Fig. 2.
Conditioned medium from co-culture contains active MMP-9, which is crucial for lumen filling and mediates sE-cad shedding in MDCK cysts. (A) Representative immunoblot from three independent experiments showing MMP-9 levels in the supernatant from MDCK 3D cultures. Quantification data are shown underneath the blot and are expressed as mean±s.e.m. from three independent experiments. (B) Representative zymogram from three independent experiments showing MMP-9 activity. Lane 1, MDCK control; lane 2, co-culture; lane 3, co-culture+10 µM MMP-9 inhibitor. The intensity of MMP-9 bands normalized to control is shown. (C) Confocal images showing co-culture in presence and absence of 10 µM MMP-9 inhibitor after 24 h treatment. Note the absence of lumen filling with MMP-9 inhibition (right panel). (D) Quantification of lumen filling in MDCK cysts in the presence and absence of MMP-9 inhibitor from an average of three independent experiments. Results are mean±s.e.m. ***P<0.0001 (Student's t-test). (E) Representative immunoblot from two independent experiments showing E-cadherin levels in MDCK and MSV-MDCK cells. β-actin is used as a loading control. (F) Diagrammatic representation of the Transwell co-culture system. (G) Top panel, zymogram showing MMP-9 activity in the conditioned medium from the bottom chamber of the Transwell. A dose-dependent increase in MMP-9 levels with increasing number of MSV-MDCK cells in the bottom chamber was observed. 10 µM of MMP-9 inhibitor was used to block MMP-9 activity in the bottom chamber. Bottom panel, immunoblot showing sE-cad levels in the conditioned medium (CM) in the bottom chamber of the Transwell. (H) Immunoblot showing increased sE-cad levels in the co-culture conditioned medium. Note that in the presence of MMP-9 inhibitor, sE-cad levels were reduced. (I) Immunoblot showing sE-cad levels in the bottom chamber of a Transwell assay consisting of MCF10A and MDA-MB435S cell lines. Quantification data are shown as mean±s.e.m. from three experiments underneath the blots for A,G,H and I.

