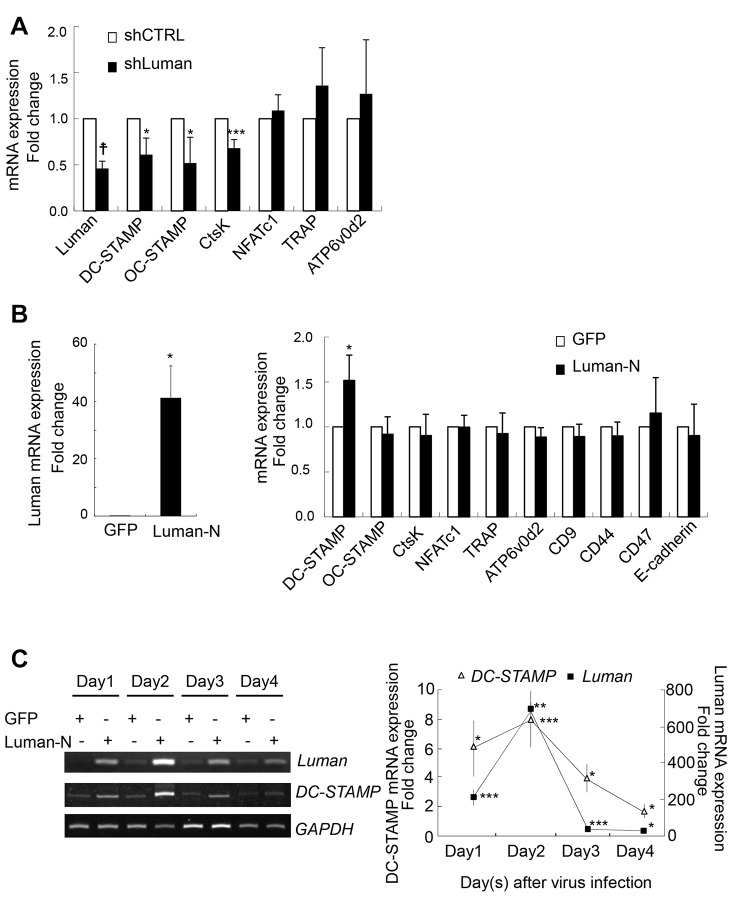
Fig. 4.
Luman regulates DC-STAMP expression during osteoclastogenesis. (A) BMMs that had been infected with shCTRL or shLuman #1 (shLuman) retroviral vectors were cultured with M-CSF and RANKL for 2 days. The expression levels of osteoclast genes were determined by using real-time PCR analysis. Data are from three independent experiments. Values indicate mean±s.e.m. *P<0.05; ***P<0.005; †P<0.001. (B) BMMs were infected with GFP- or Luman-N-terminus-expressing retroviral vectors (GFP and Luman-N, respectively). After viral infection, BMMs were cultured with only M-CSF for 4 days. The expression levels of Luman and osteoclast genes were determined by real-time PCR analysis. Left, Luman mRNA expression levels in GFP or Luman-N infected cells. Right, mRNA expression levels of each gene in GFP- (□) or Luman-N-infected (▪) cells. Data are from three independent experiments. Values indicate mean±s.e.m. *P<0.05. (C) BMMs that had been infected with GFP- or Luman-N-terminus-expressing retroviral vectors were cultured with only M-CSF for the indicated periods. The expression levels of Luman and DC-STAMP mRNA were determined by using RT-PCR (left) and real-time PCR (right) analyses. Quantification chart indicates the fold induction relative to that of GFP-expressing samples. Data are from three independent experiments. Values indicate mean±s.e.m. *P<0.05; **P<0.01; ***P<0.005.

