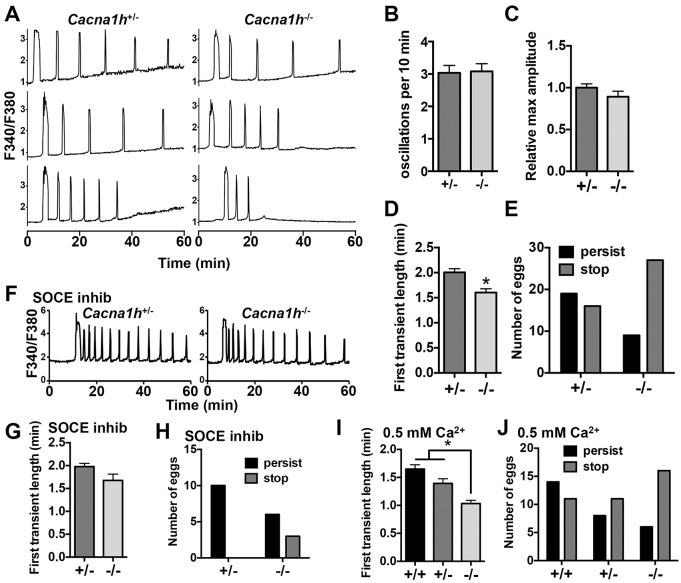
Fig. 2.
Ca2+ oscillation pattern following IVF for Cacna1h−/− eggs. Ratiometric Ca2+ imaging of Cacna1h+/− and Cacna1h−/− eggs was performed during IVF. (A) Representative traces are shown. (B,C) Graphs show oscillation frequency and relative maximum amplitude (n=22–24 eggs per genotype over three replicate experiments). Results are not significantly different (Mann–Whitney test). (D) First transient length in minutes (n=36–37 eggs per genotype over seven replicate experiments). *P<0.05 (Mann–Whitney test). (E) Persistence of oscillations to the end of the 60-min imaging period differed significantly between genotypes (P<0.05, Fisher's exact test, n=35–36 eggs per genotype over seven replicate experiments). (F–H) IVF experiments were repeated with addition of 2 μM GSK1349571A (SOCE inhibitor) to the imaging medium; representative traces and graphs of first transient length and oscillation persistence are shown (n=9–12 eggs per genotype over three replicate experiments). Results are not significantly different (Mann–Whitney and Fisher's exact test). (I,J) IVF experiments were performed in low-Ca2+ medium (0.5 mM) with Cacna1h+/+, Cacna1h+/−, and Cacna1h−/− eggs; graphs of first transient length and oscillation persistence are shown (n=19–25 eggs per genotype over five replicate experiments). *P<0.05 (Kruskal-Wallis with Dunn's multiple comparison test) in I; and P<0.05 in J (χ-square test for trend). Results are mean±s.e.m.

