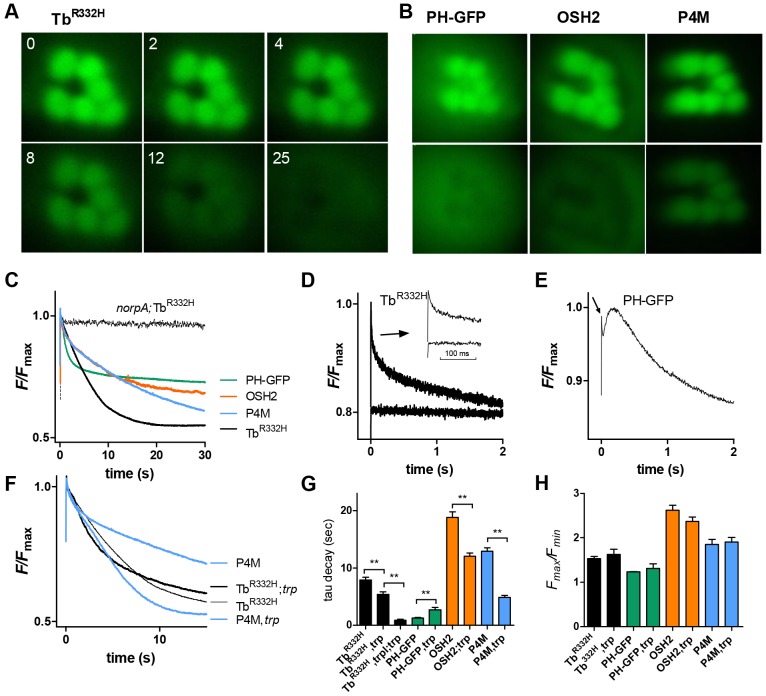
Fig. 2.
Timecourse of translocation from DPP of intact flies. (A) Images of DPP fluorescence in flies expressing TbR332H taken at 0, 2, 4, 8, 12 and 25 s after onset of blue excitation in an initially dark-adapted fly. (B) DPP fluorescence in flies expressing PH–GFP, OSH2 and P4M. The top image in each pair was taken at t=0; lower images were taken 5 s (PH–GFP) or 60 s (OSH2 and P4M) later. TbR332H, OSH2, OSH1 and P4M were expressed under control of the Rh1 promoter, hence the central R7 rhbadomere appears as a dark hole lacking GFP; PH–GFP was expressed using the trp promoter and is also expressed in R7. (C) Representative PMT measurements of DPP fluorescence (sampled at 50 Hz from cropped regions, corresponding approximately to fields shown in A and B). Each probe decayed (translocated) with a characteristic timecourse similar to that seen in dissociated ommatidia (compare with Fig. 1B). No translocation was detected in the null PLC mutant (norpAP24). (D) Rapid changes in TbR332H fluorescence (sampled at 500 Hz). An initial rapid transient (arrow, the inset shows a faster timebase) reflects M to R photoisomerisation by the blue excitation and was not seen if M was not first reconverted into R by orange–red light (lower traces). (E) Rapid changes in PH–GFP fluorescence. After the R-to-M transient (arrow), fluorescence increased briefly (∼200 ms) before decaying. (F) Traces of fluorescence decay of P4M and TbR332H on wild-type (same traces as in C, but note the different timescale) and trp mutant backgrounds. (G) Time constants (tau, single exponential fits) of fluorescent decay traces in wild-type and trp backgrounds (mean±s.e.m., n=6–13). Decay was significantly (**P<0.005, two-tailed unpaired Student's t-test) faster in trp mutants for OSH2, P4M and TbR332H, but slower than for PH–GFP. Decay for TbR332H was faster still (0.87 s) on the trpl;trp background. (H) Extent of translocation (Fmax/Fmin ratio) for each probe was similar on wild-type and trp backgrounds (mean±s.e.m., n=5–12). Note that comparisons of Fmax/Fmin between probes are not reliable because each transgene confers a different eye colour, which influences Fmax/Fmin (see Materials and Methods and Fig. S2). PH–GFP was expressed on a cn, bw (white-eyed) background (hence low Fmax/Fmin values); eye colour of others were various shades of orange.

