
Table 4.
Relative ranking of lacZ mutagenic potency for each compound in glandular stomach (GS), small intestine (SI), liver, (Lv), lung (Lg), and bone marrow (BM), as well as micronucleus (MN) induction response in reticulocytes (RETs) and normochromatic erythrocytes (NCEs). The last row shows mean rank across all compounds for a given tissue/endpoint.
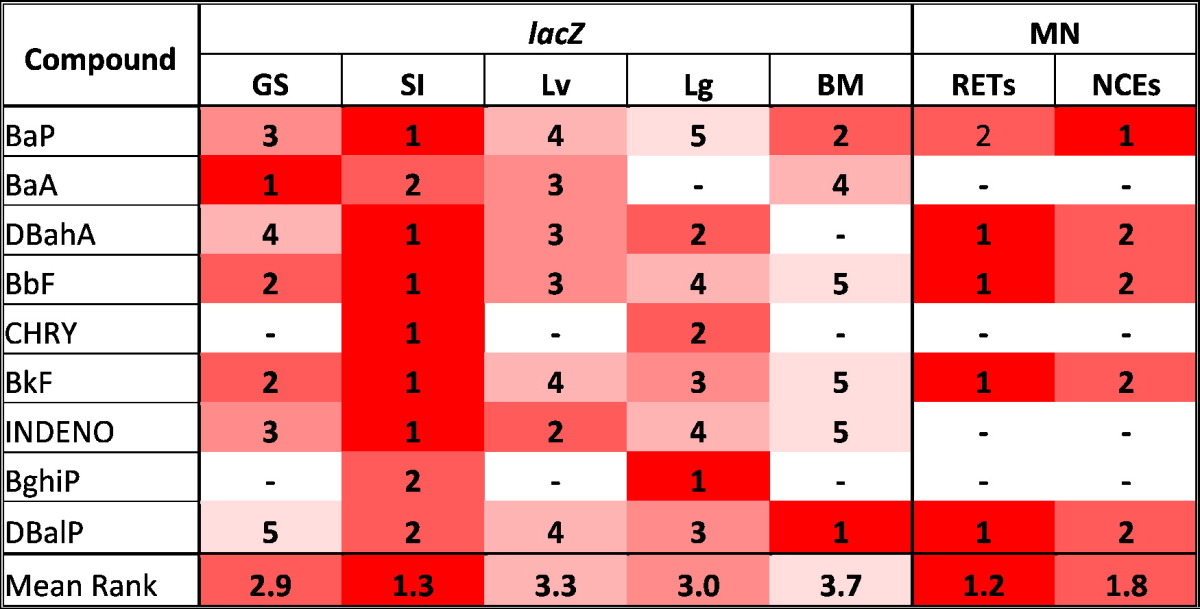
Potencies are ranked 1–5. 1: highest potency for each compound per assay. 5: lowest potency for each compound per assay. –: negative response.