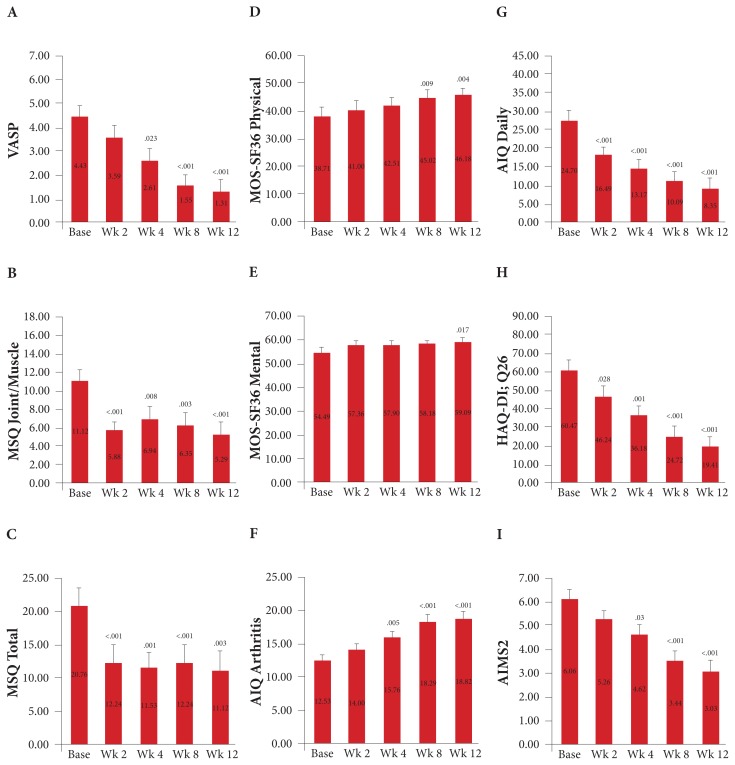
Figure 1.
Mean changes in a series of quality-of-life and arthritis-related questionnaires from baseline to 12 wk among 17 participants with chronic joint pain. Figure 1A shows the scores on the VAS-P. Figure 1B shows the joint/muscle scores and Figure 1C shows the total scores on the MSQ. Figure 1D shows the scores for the physical subscale and Figure 1E shows the scores for the mental subscale on the MOS-SF36. Figure 1F shows the scores for the arthritis symptoms subscale and Figure 1G shows the scores for the daily living subscale on the AIQ. Figure 1H shows the scores for Q26 on the HAQ-DI; Q26, which indicates participants’ overall pain during the week prior to the questionnaire. Figure 1I shows the scores on the AIMS2. Mean values are displayed in the midbar, and the error bars indicate the standard error. P values indicate a significant difference compared with baseline.
Abbreviations: VAS-P, visual analog scale for pain; MSQ, medical symptoms questionnaire; MOS-SF36, health and wellness outcome questionnaire; AIQ, arthritis impact questionnaire; Q26, question 26; HAQ-DI, health assessment questionnaire; AIMS2, arthritis impact measurement scales 2.

