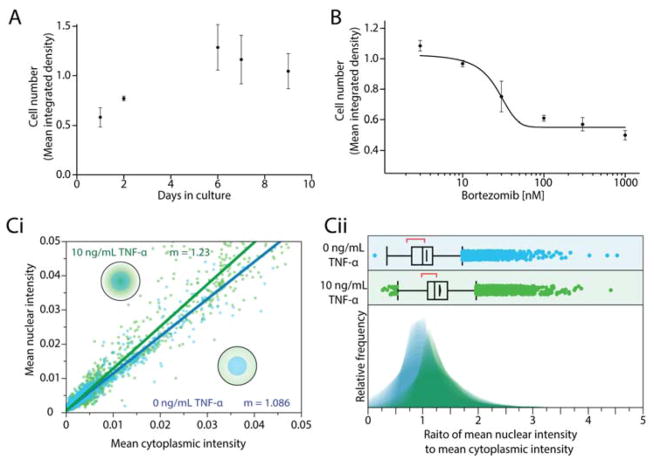
Figure 4.
Open hanging droplet platform facilitates key cell culture manipulations and readouts. (A) Two alternate methods for imaging cells. (A) Long term culture: Growth of MM.1S cells in device across a 9-day culture. Error bars represent the standard error of the mean (SEM) of 7 wells. (B) Cell viability assays in response to in situ treatment: Growth inhibition response curve of MM.1S cells to increasing concentrations of bortezomib in culture. Error bars represent the SEM of 5 wells. (C) Characterization NF-κB nuclear translocation in MM.1S cells following treatment with 10 ng/mL of TNF-α (green) or no treatment (blue). (Ci) Scatter plot of mean nuclear intensity versus mean cytoplasmic intensity. (Cii) Histograms of the ratio of mean nuclear intensity to mean cytoplasmic intensity for the population of cells.

