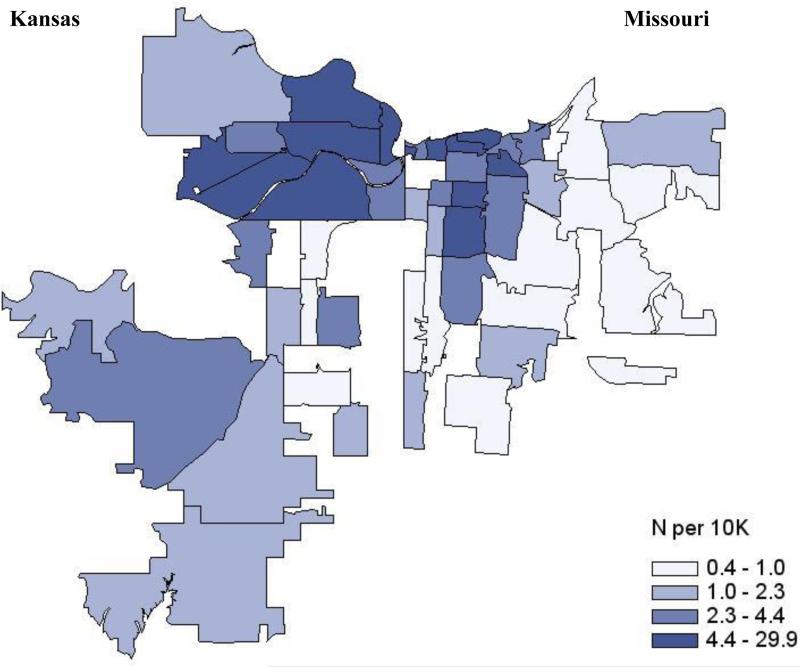
Figure 1. Density of Female Incarcerated Participants per Population, Kansas City Metropolitan Area, N=290.
Shaded areas represent the frequency of our participants’ zip codes per 10,000 residents. For example, the darkest shaded areas indicate that for every 10,000 people in that zip, at least 4.4 women were surveyed by us, but we could have surveyed anywhere between 4.4 – 29.9.

