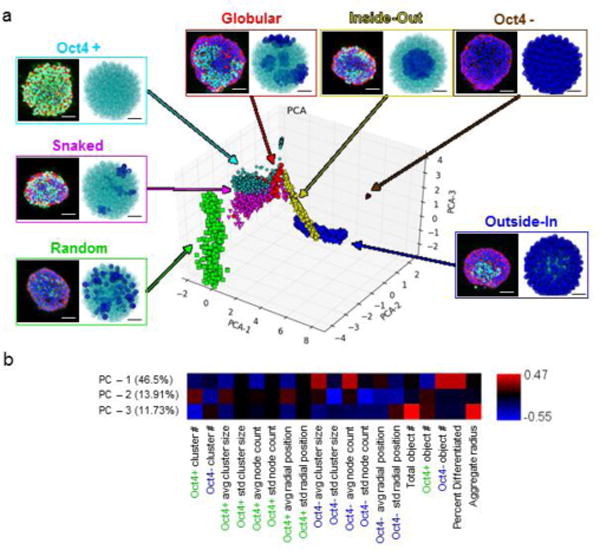
Figure 1.

Validation of spatial network metrics for pattern classification. (a) Examples of experimental (green = Oct4 Ab, blue = DAPI, red = phalloidin) and in silico generated pattern classes (teal = Oct4+, blue = Oct4 −). Scale bars = 100 μm and 35 μm for the experimental and in silico images, respectively. Representative images are mapped onto the PCA plot of the resulting pattern space, color coded by individual pattern type. (b) PCA axis analysis indicating the relative contribution of each metric to the given principal component axis.
