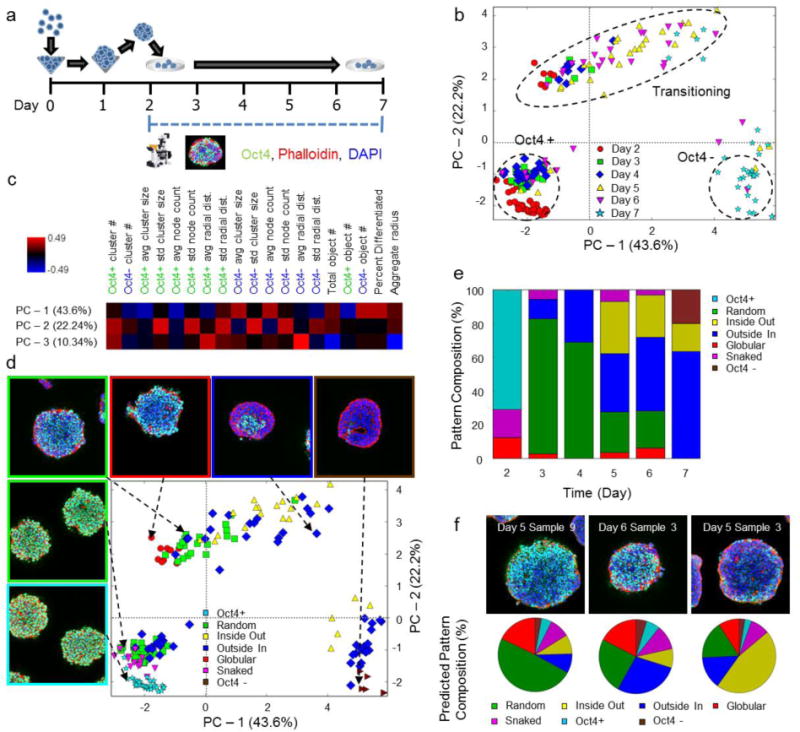
Figure 2.

Evaluation of spatial and temporal patterns during early ESC aggregate differentiation. (a) Experimental plan and time course; confocal microscopy was performed daily (on days 2–7). (b) PCA trajectory for 1000 cell aggregates. Dashed regions highlight different cell states present. (c) Heat map of the weights of each metric in relation to each principal component. (d) Annotations for the pattern classification of each sample. (e) Pattern compositions for each day of differentiation. (f) SVC classification of samples that contain aspects of multiple core pattern classes. Experimental images (top row) and, predicted pattern composition (pie charts, bottom row). The predicted pattern composition is represented as a percent of the different sub-patterns contained within.
