Figure 3.

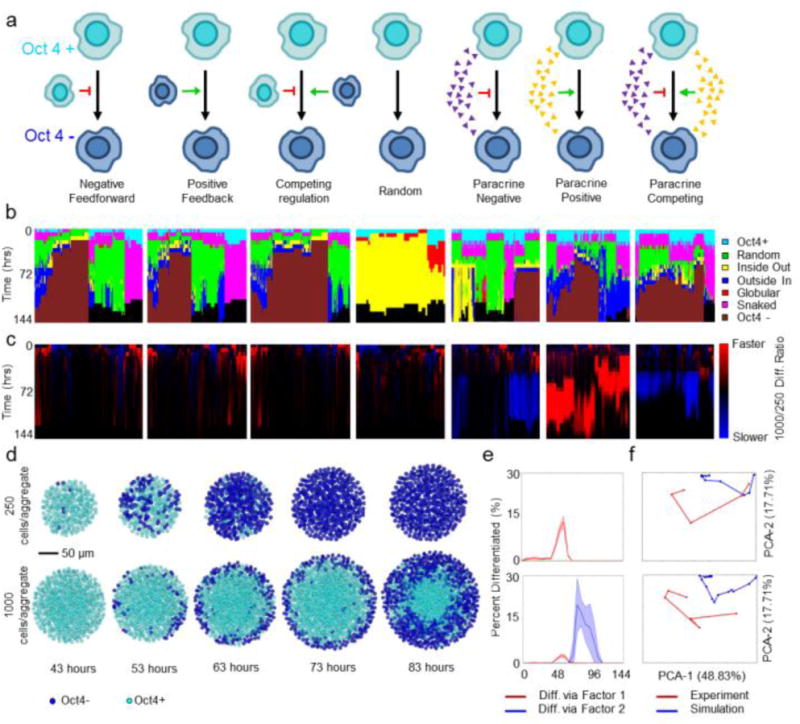
Characterization of computational pattern trajectories and comparison to experimental patterns. (a) Description of rules governing modeling. Red arrows, negative feedback; green arrows, positive feedback; small triangles indicate a soluble morphogen gradient. (b) Hierarchal clustering using a Ward linkage algorithm of the pattern trajectories for each parameter set, annotated by rule (gray scale bar). (c) Ratio of the 1000-cell to 250-cell differentiation rate. Blue represents slower differentiation in 1000-cellular aggregates, while red represents faster differentiation. (d) Representative images of the differentiation trajectories predicted by the competing paracrine rule (cells in blue are Oct4−, cells in teal are Oct4+). (e) Percent differentiation for representative 250 (top) and 1000-cell (bottom) simulations. Red represents differentiation induced via absence of inhibitor, while blue represents differentiation induced via the agonist. (f) PCA projections indicating the best fits of the 250 (top) and 1000-cell (bottom) experimental data (red) to the simulations (blue).
