
Figure 1. The copy number distributions of the amylase genes and the structural haplotypes of the amylase locus.
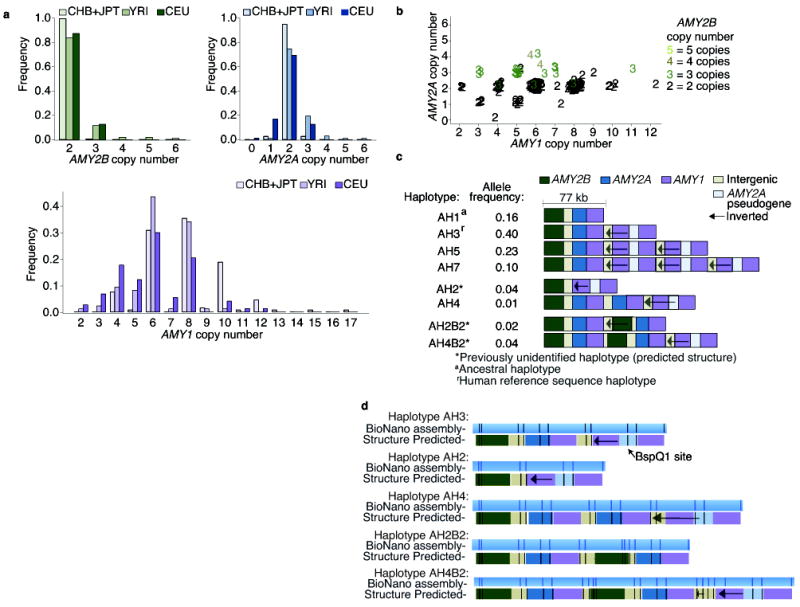
Whole-genome sequence data from European (CEU), Yoruba (YRI), Chinese (CHB), and Japanese (JPT) population samples from the 1000 Genomes Project were analyzed for AMY1, AMY2A, and AMY2B copy number using Genome STRiP. (a) The populations have similar distributions of AMY2A and AMY2B, but a different distribution for AMY1 (KS test, P value = 3 × 10⁻⁶). For AMY1, even copy numbers greatly outnumber odd copy numbers. (b) In the YRI and CEU population samples, AMY2A and AMY1 share parity in 98% of individuals: when AMY2A copy number is odd, so is AMY1 copy number. JPT and CHB samples had very few odd copy numbers and were excluded from the figure. (c) A preliminary map of eight common structural forms of the amylase locus in Europeans, derived from the above analysis and with structural features ordered using earlier data from cosmid mapping and (d) genome mapping experiments to analyze the haplotypes (AH2, AH3, AH4, AH2B2, AH4B2). Additional structural forms found only in African genomes are described in Supplementary Fig. 4.