
Figure 3. The association analysis of AMY1 copy number to obesity or BMI in three cohorts.
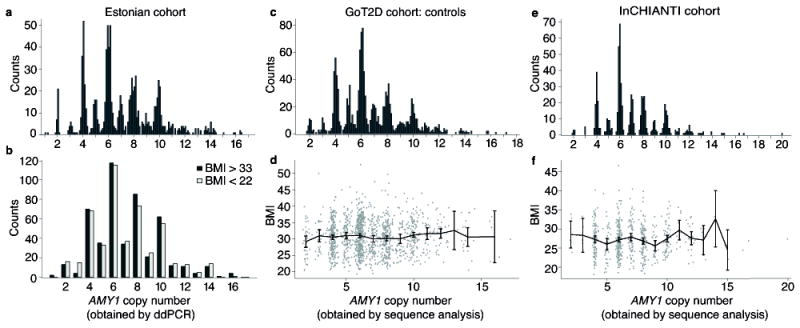
Out of a cohort of 51,535 Estonians, those in the tails of the BMI distribution (500 individuals with BMI < 22 | 500 individuals with BMI > 33) were measured for copy number of all three amylase genes and genotyped for SNPs in obesity-related genes. (a) Measurements of AMY1 copy number in the Estonian cohort. (b) Obese and lean individuals show indistinguishable distributions of AMY1 copy number (P > 0.05). Statistical tests were performed on raw measurements as well as AMY2A-informed AMY1 copy number (Methods). (c) Measurements of AMY1 copy number and (d) association are shown for the GoT2D cohort controls. (e) Measurements of AMY1 copy number and (f) association are shown for the InCHIANTI cohort. Points are the mean BMI for each AMY1 copy number. Error bars are the 95% confidence intervals.