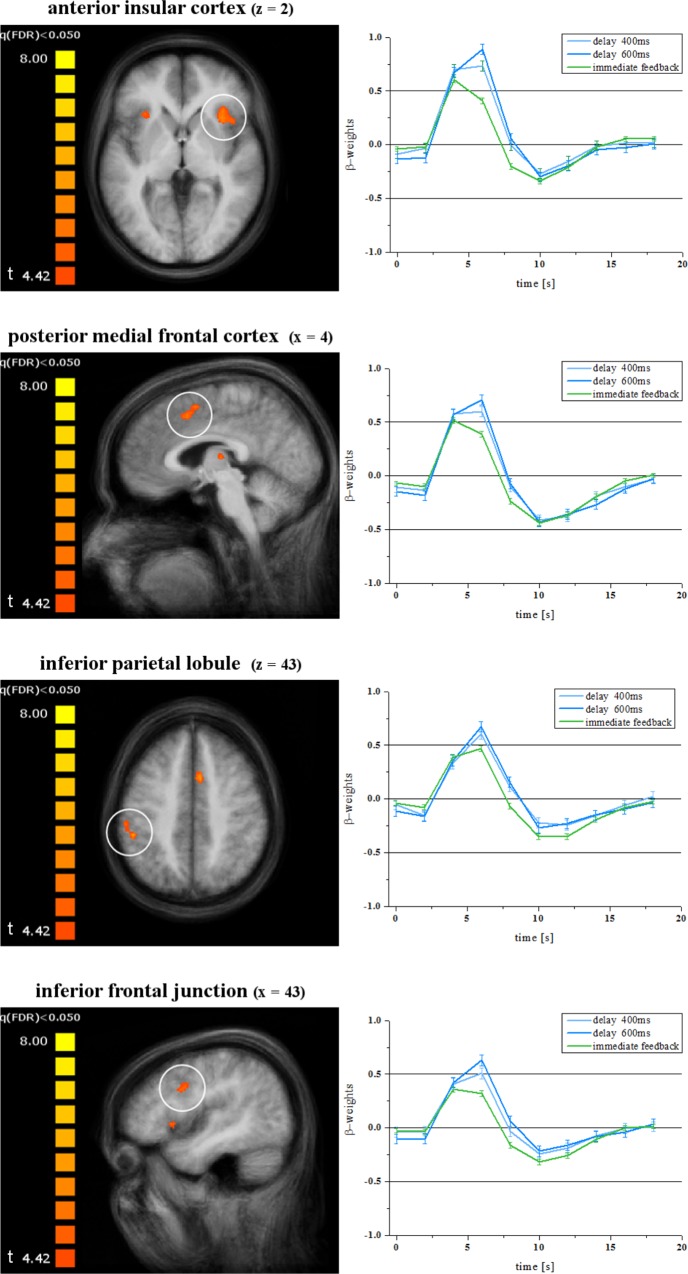
Fig 1. Experiment 1 –Activity in the anterior insular cortex, posterior medial frontal cortex, left inferior parietal lobule and right inferior frontal junction.
Regions with stronger activation in response to delays of 600 ms or 400 ms each compared to the immediate feedback (left side: activation clusters, right side: BOLD time course). Delays of 200 ms are not significantly different compared to immediate feedback. Error bars indicate standard errors of the mean.

