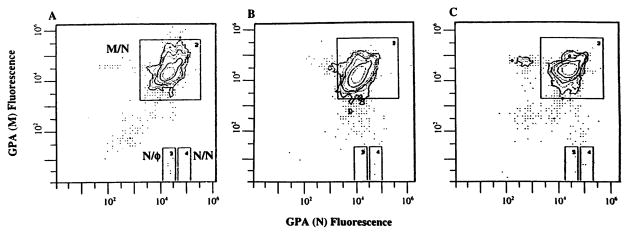
Fig. 3.
Flow distributions of labeling intensities from the analysis of 1×10⁶ erythrocytes via the GPA assay from the concurrent normal control (A), the patient (B), and her mother (C). The vast majority of cells have the normal M/N phenotype and exhibit equal labeling with the M-specific and N-specific monoclonal antibodies. Directly below this main peak (at less than 1% labeling intensity) lies the N/Ø (allele loss) window, and to the immediate right, the N/N (loss-and-duplication) window (note log scales). The mother’s flow profile also exhibits a distinct peak of cells to the left of the normal peak (at ~1/3 intensity) corresponding to cells that have lost expression of the N-allele.

