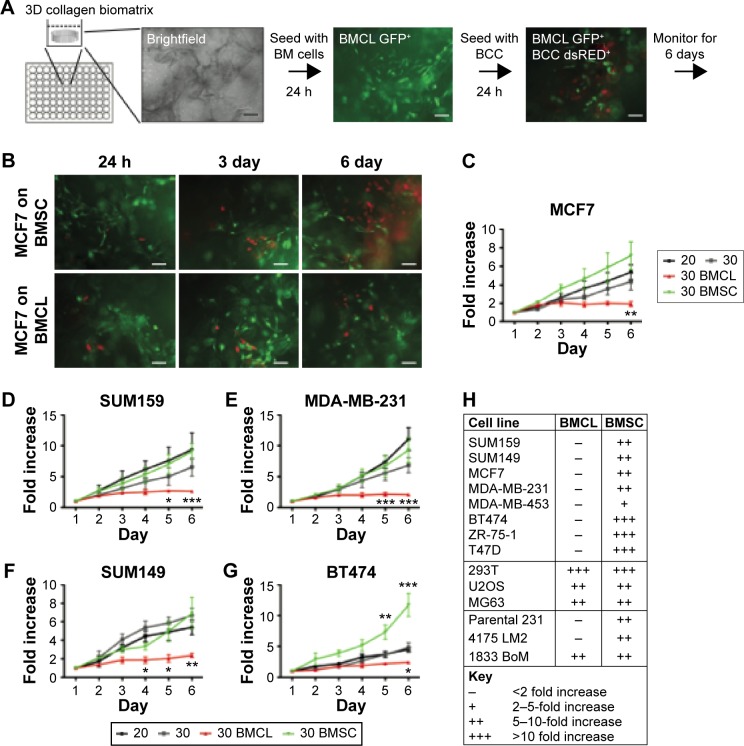
Figure 10.
Bone marrow (BM) metastatic niche models: primary bone marrow mesenchymal stem cell (BMSC) supported proliferation of breast cancer cells (supportive niche), whereas a mix of osteoblasts, mesenchymal, and endothelial cell lines (BMCLs) did not support proliferation of breast cancer cells (inhibitory niche). (A) Diagram of bone marrow niche model setup. The 3D biomatrix is seeded with GFP+ BMCL or BMSC when bone marrow cells reach subconfluency; dsRED+ BCCs are seeded in low numbers. (B) Representative images of dsRED+ MCF7 cells grown into GFP+ BMCL (bottom) or BMSC (top) over six days. Scale, 50 μm. (C–G) Total fluorescence of BCCs (MCF7, SUM159, MDA-MB-231, SUM149, and BT474) was monitored. BCCs seeded in 3D biomatrix without stromal cells (3D monoculture, 3D) and BCCs plated in standard 2D conditions (2D) were used as controls. Fluorescence is expressed as the fold increase from 24 hours after seeding (n = 6 experiments, five replicates in each experiment). Error bars, standard error of the mean. *P < 0.05; **P < 0.01; ***P < 0.001; two-way analysis of variance with Bonferroni posttest. (H) Proliferation rates of cell lines in 3D coculture. Only BCCs were found to be growth arrested in the inhibitory niche (BMCL). ER+ BCCs are indicated in bold. The fetal kidney cell line, 293t, and the osteosarcoma cell lines, U2OS and MG63, proliferate in the BMCL coculture. The subline of MDA-MB-231 1833 BoM proliferates in BMCL coculture, the parental and the 4175 LM2 lines do not.149

