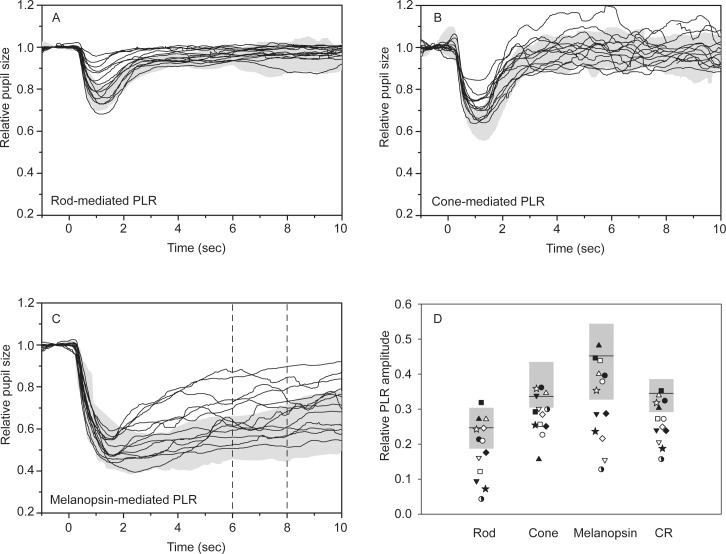
Figure 1.
Waveforms obtained under the rod (A), cone (B), and melanopsin (C) paradigms. Each trace represents a different IIH patient and the gray regions are the normal ranges. (D) The relative PLR values for each patient and the normal range for each paradigm. The relative PLR (D) is defined as 1 − the normalized pupil response.

