
Figure 2.
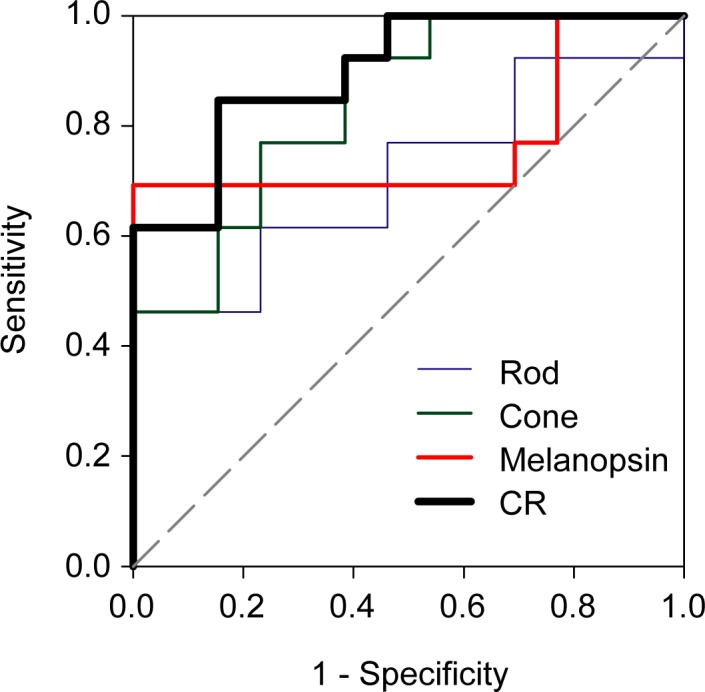
Receiver operating characteristic curves for the rod (blue), cone (green), melanopsin (red), and combined PLR (black). The proportion of the IIH patients classified as abnormal (sensitivity) is plotted as a function of the proportion of the controls classified as abnormal (1-specificity; false positives). The PLR cutoff values, sensitivity, specificity, AUC, SE, and corresponding P value are given in the Table.