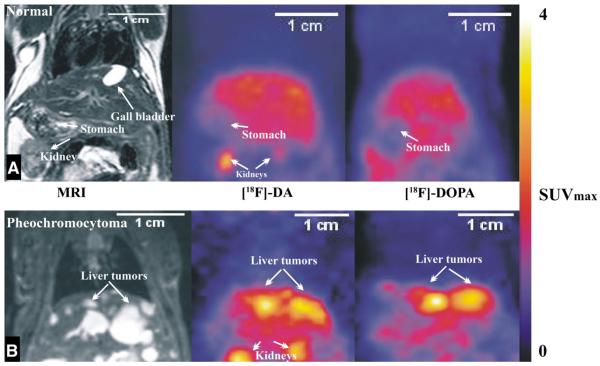
Fig. 2.
Combined coronal MRI images of representative mouse superimposed with PET images after administration of [18F]-DA and [18F]-DOPA to a control animal (A) and an animal previously injected with MPC cells (B). The color scale indicates maximal standardized uptake values (SUVmax). The usual range for liver tumors with [18F]-DA is 1.5–2.5 SUVmax and for [18F]-DOPA it is 3–3.6 SUVmax.

