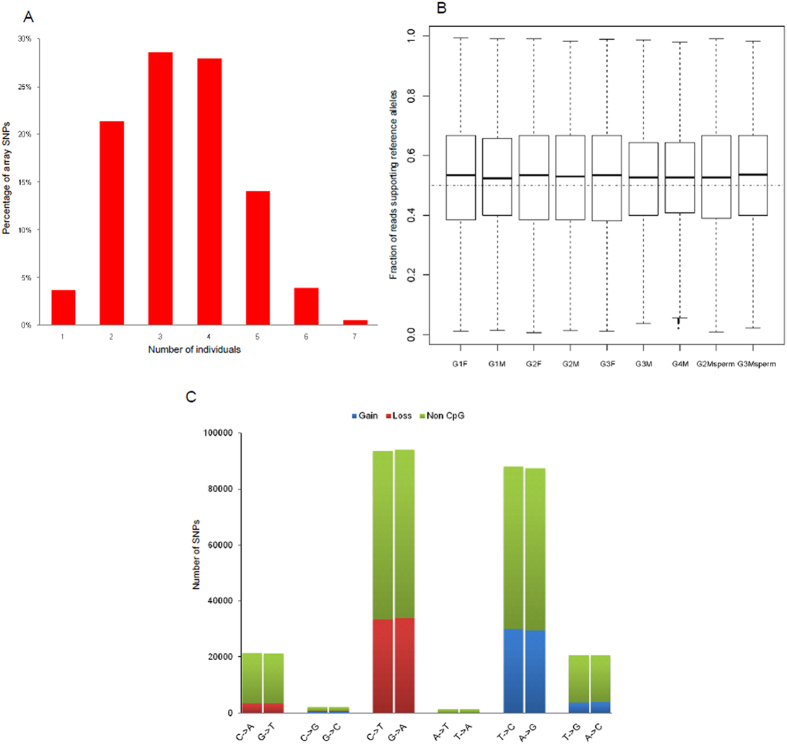
Figure 2. The distribution patterns of SNPs genotyped by the Illumina arrays.
(A) Percentages of heterozygous SNPs that were shared by different numbers of individuals. (B) Fractions of reads supporting reference alleles for the heterozygous sites that were covered by at least 10 reads. (C) The mutation spectrum of SNPs genotyped by the Illumina arrays. The ratio of the number of SNPs resulting in loss of a CpG site to the number of SNPs resulting in gain of a CpG site was 1.10.

