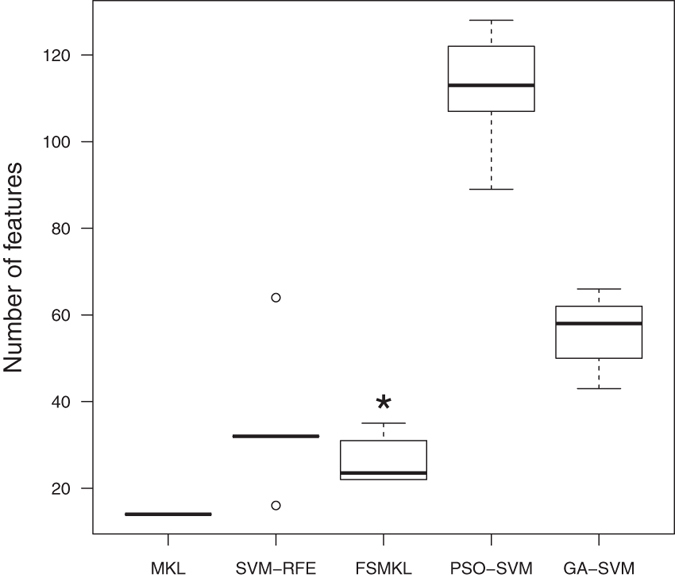
Figure 5. Number of features selected by each technique during the experimentation.

This boxplot shows the stability and the number of features by each technique during the cross-validation process of the ten experiments. *Statistically significant difference with a p-value < 7.74 × 10−06 according with a pairwise Wilcoxon test: SVM-RFE and FSMKL.
