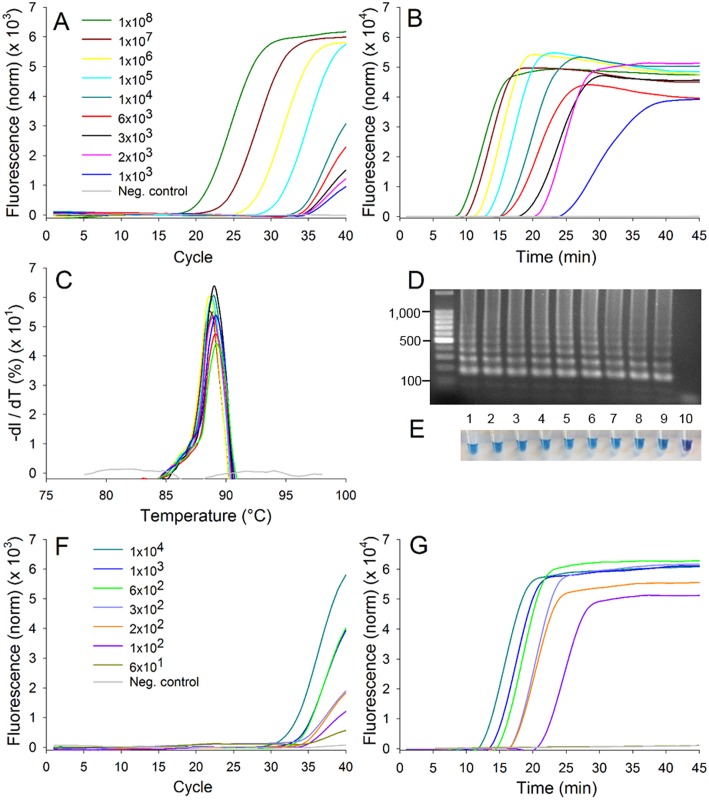
Fig 2. Reaction curves for qPCR and real-time LAMP.
(A) qPCR and (B) LAMP amplification curves of pure bacterial DNA. (C) DNA melting curves for the LAMP assay in (B). (D) Gel electrophoresis results of the same samples processed in (B). Samples were run in 1.5% agarose gel with 100 bp DNA ladder and stained with ethidium bromide. (E) End product-detection with HNB dye of the same samples processed in (D). Samples 1–10 in (D) and (E) had the same concentration of X. fragariae as shown in the legend of (A) from top to bottom. (F) qPCR and (G) LAMP amplification curve of X. fragariae-spiked leaf samples processed through the sample preparation procedure.

