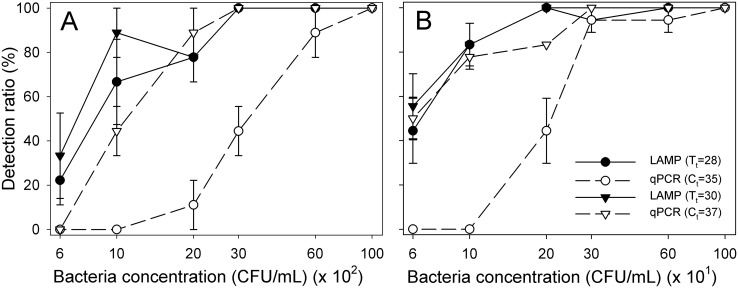
Fig 3. Detection rates of LAMP and qPCR.
(A) DNA extracted from pure Xanthomonas fragariae cells. (B) DNA extracted from mixtures of X. fragariae cells and strawberry tissues after 21 h of incubation. Mean detection rates were calculated based on the percentage of positive samples at selected thresholds in 9 (3 samples per experiment) and 18 samples (6 samples per experiment) per bacterial concentration in (A) and (B), respectively. Error bars are standard errors of the means.

