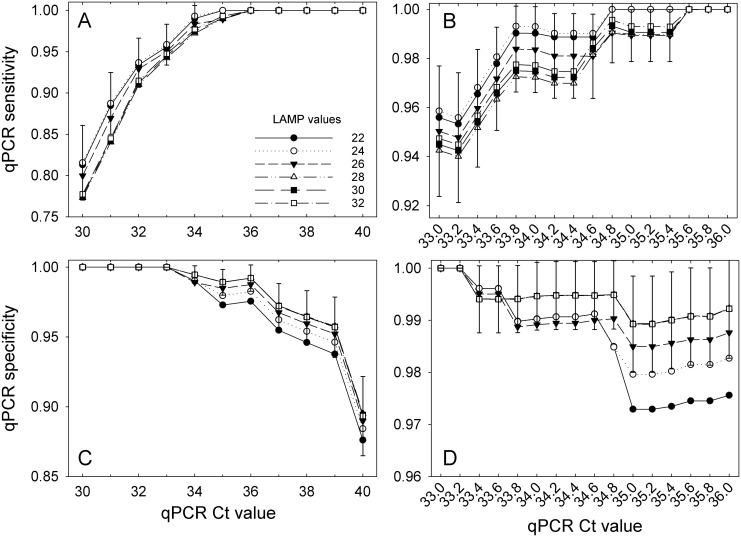
Fig 4. qPCR sensitivities (A, B) and specificities (C, D) relative to LAMP assay results.
The sensitivities and specificities were estimated through latent class analyses for each combination of qPCR Ct and LAMP Tt threshold values. Error bars are standard errors of the means and are shown for a select series in each plot to avoid clutter. The series with the largest error was typically chosen as the representative series. Data points lacking error bars for that series were either too small or were not estimable by the MLE procedure.

