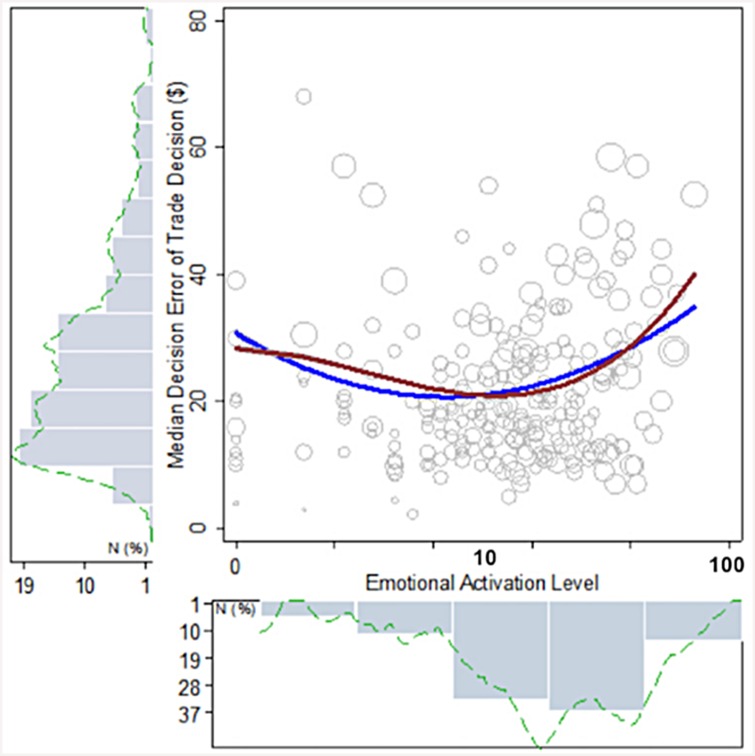
Fig 4. Daily Online Emotional Activation and Daily Median Decision Errors in Stock Trading Decisions.
The figure shows the relationship between emotional activation and stock trading decision errors for trader #7. Size of scatter points represent the number of observations. The red line is a non-parametric lowess spline fit and the blue line is a quadratic fit. Plots for each trader are shown in the S1 File.

