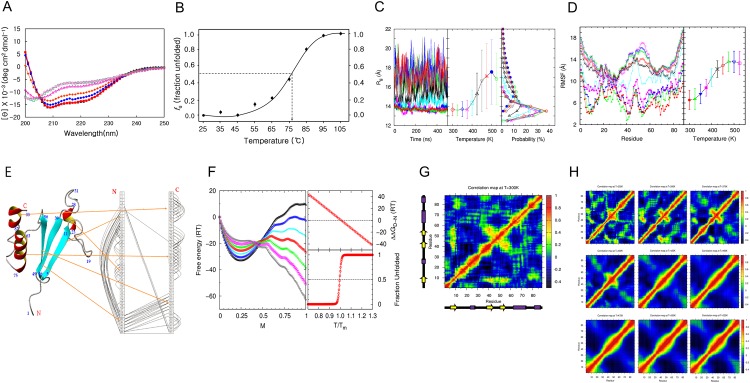
Fig 1. Thermal folding-unfolding of MTH1880.
(A) Data were acquired at 25°C (black triangle), 45°C (red square), 65°C (blue circle), 75°C (yellow square), 85°C (red triangle), 95°C (green square), and 105°C (red circle). Protein concentration was ~25 μM in a cell of 0.1 mm path length. (B) The fraction of unfolding extracted from far-UV CD spectra at 222 nm with a constant heating rate of 10°C/h as a function of temperature was plotted and fit by a sigmoidal curve. The transition mid-temperature (Tm) of MTH1880 was 76 ± 0.5°C. (C) Results from molecular dynamics (MD) simulations. (Left panel) Radius of gyrations (Rg) of MTH1880 as a function of time at temperatures from 300 K to 525 K. (Middle panel) Rg averaged over 400,000 snapshots in the time window from 100 ns to 500 ns. The error bar denotes one standard deviation. (Right panel) The probability distribution of Rg is plotted for each temperature and results in sharp distributions at low temperatures and broad distributions at high temperatures. (D) (Left panel) Atomic fluctuation (RMSF) of MTH1880 by residue in the same time window and same temperatures as (C). (Right panel) RMSF averaged over 88 residues. (C, D) This data were acquired at 300K(red filled circle), 325K(green filled triangle), 350K(blue filled triangle), 375K(pink filled square), 400K(cyan cross), 425K(black cross), 450K(red circle), 475K(green triangle), 500K(blue triangle), and 525K(pink square). (E) Secondary structures of MTH1880 are shown with residue numbers. A ladder diagram displays residue-residue pairwise contacts denoted by a semicircle line with the distance cut-off 6.5A to emphasize the major topology of pairwise residue-residue interactions based on three-dimensional structure of MTH1880. (F) Extended Munoz-Eaton (ME) model. Data were acquired at 0.7Tm(black reverse triangle), 0.8Tm(pink square), 0.9Tm(green cross), 1.0Tm(red circle), 1.1Tm(cyan cross), 1.2Tm(blue square), and 1.3Tm(black triangle). (Left panel) Free energy (ΔG) landscape of MTH1880 as a function of the reaction coordinate, where M = 0 denotes the fully denatured structure and M = 1 denotes the native structure. The free energy of folding ΔΔGD-N (ΔGD—ΔGN, right top panel) and the fraction of unfolded protein as a function of the reduced temperature (T/Tm), where Tm is the transition mid-temperature (right bottom panel). At T = Tm, ΔΔGD-N = 0, and the fraction of unfolding is 0.5. (G) Correlation matrix of MTH1880 at 300 K is calculated from 400,000 snapshots in the same time window as (C). The secondary structure of MTH1880, in the N to C direction, are depicted next to the axes. (H) Correlation matrix of MTH1880 at (Top left to right) 325K, 350K, 375K, (Middle left to right) 400K, 425K, 450K, (Bottom left to right) 475K, 500K and 525K.

